

Introduction
Two types of integrations can be done with Datadog:
- You can send Aviatrix Controller and Gateways Metrics or/and Logs to Datadog. From the Aviatrix side, this integration can be done either from Controller or CoPilot. There is no need to do it on both Controller and CoPilot at the same time.
- Send Aviatrix CoPilot Alerts to Datadog
Aviatrix Controller and Gateways Metrics/Logs
Aviatrix Controller and Gateway Metrics and Logs can be exported to Datadog. Please notice that Datadog Agent uses HTTPS to send data to Datadog (https://docs.datadoghq.com/agent/proxy/?tab=linux).
It is possible to create such an integration from either Controller (old way) or CoPilot (new way). This document presents both ways. The data sent to Datadog is the same regardless of the way the integration is done (Controller or CoPilot).
The instruction below shows the required steps.
Datadog Configuration
- Generate API Key in Datadog
- Go to Organization Settings (accessible through your account
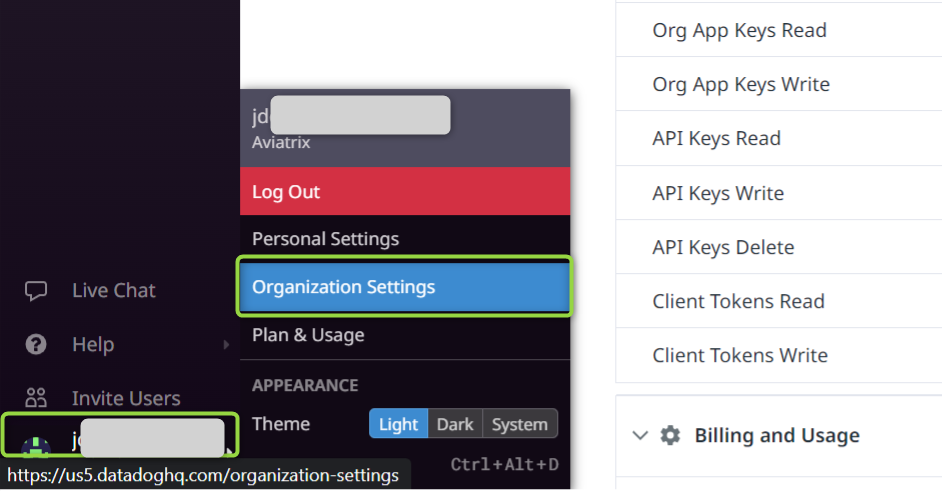
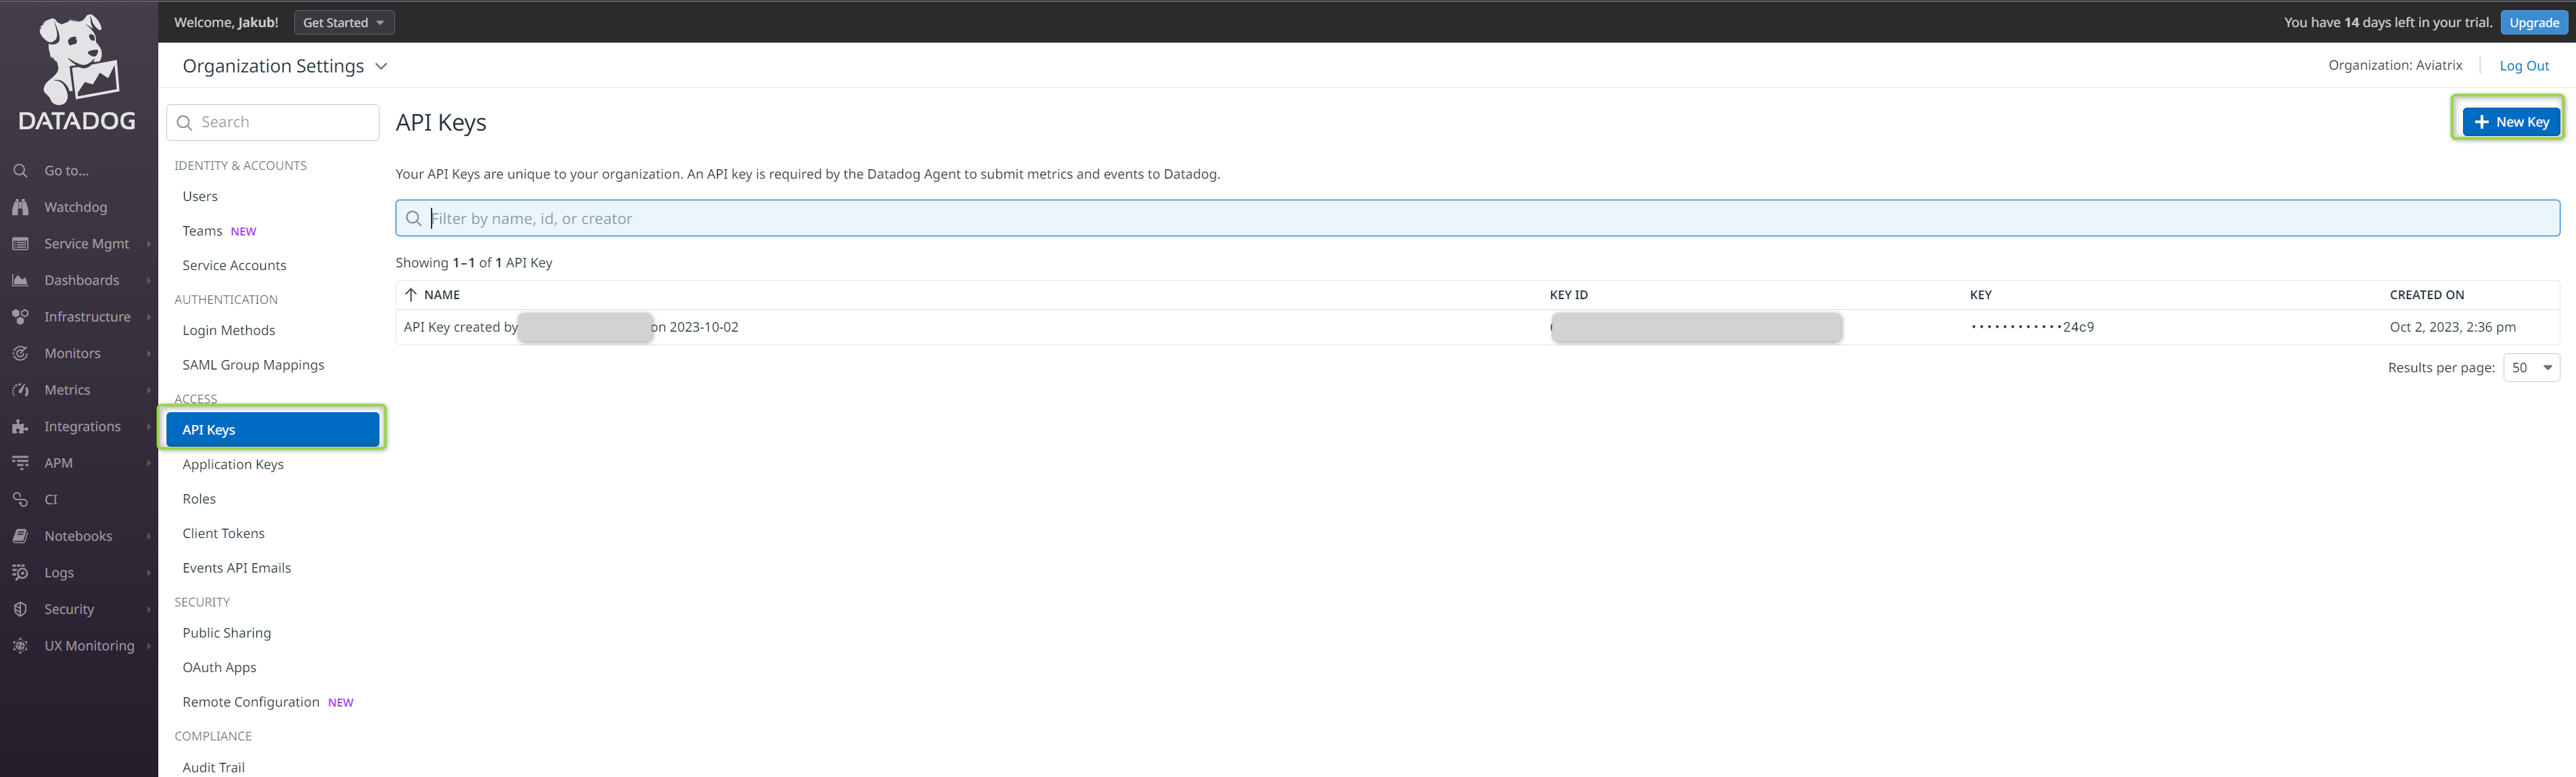
- Select “API Keys” and “+ New Key”
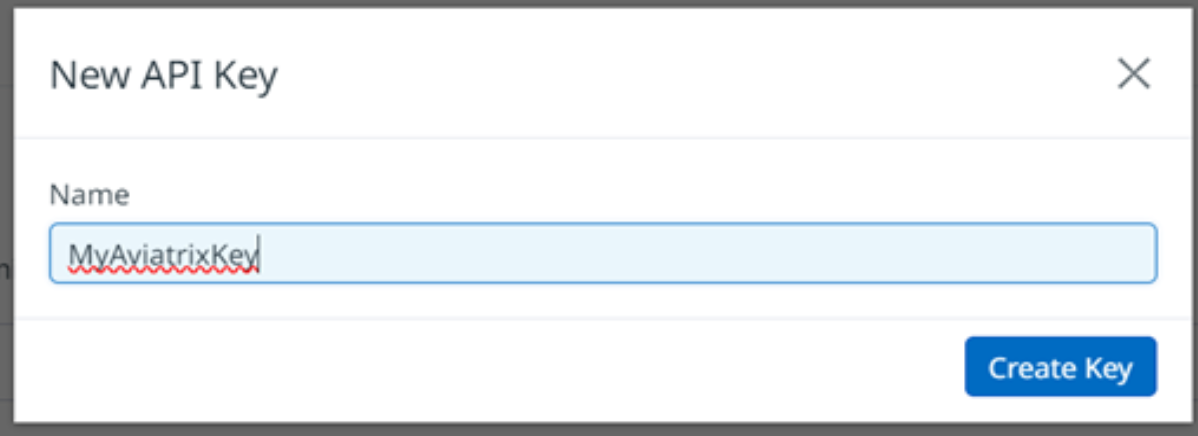
- Provide the name of the key
Aviatrix Controller Configuration
Configure Aviatrix Controller
-
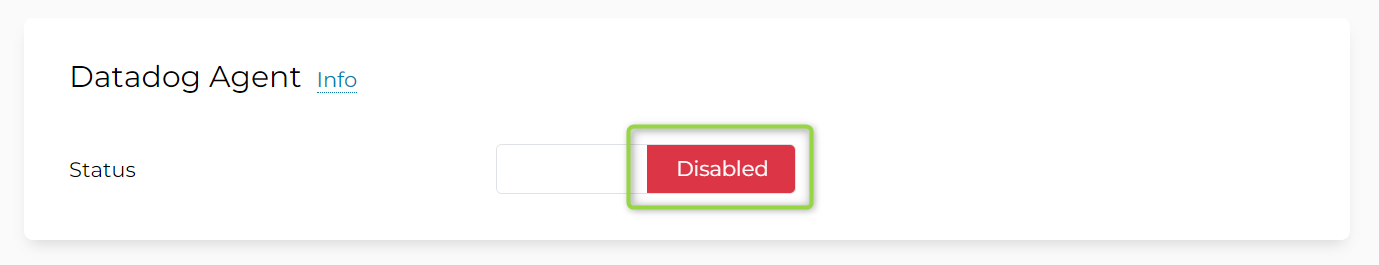
- Go to Logging -> Settings
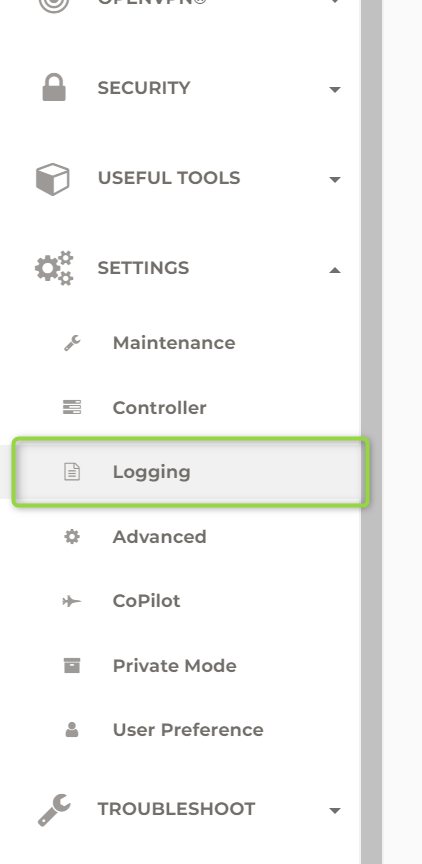
- Scroll down to “Datadog Agent” and click on “Disabled”
- Provide the required pieces of information:
- API Key
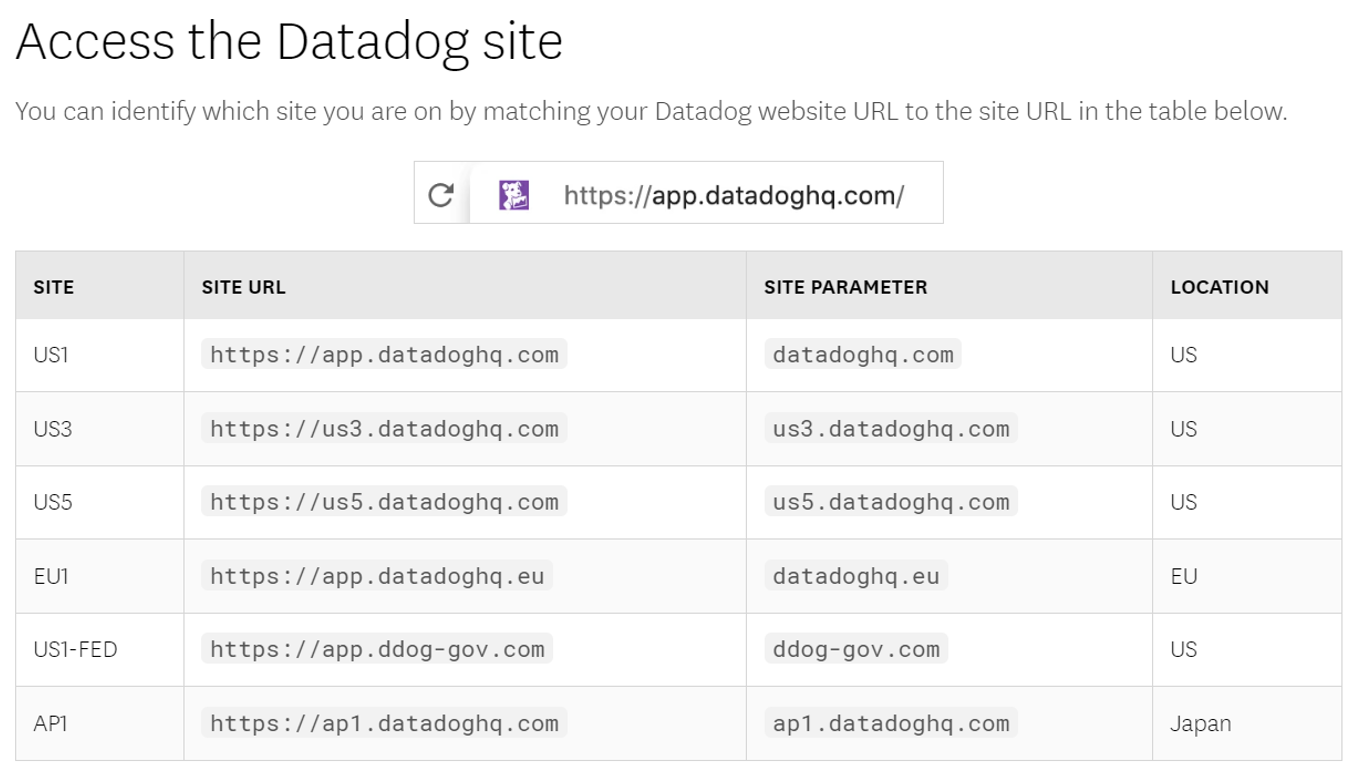
- Site (please select the proper Datadog site)
- If you click on “Advanced” additional options will appear:
- You can choose to export only Metrics and no Logs (“Export Metrics Only”)
- Or/and you can select what Gateways to include in the integration with Datadog
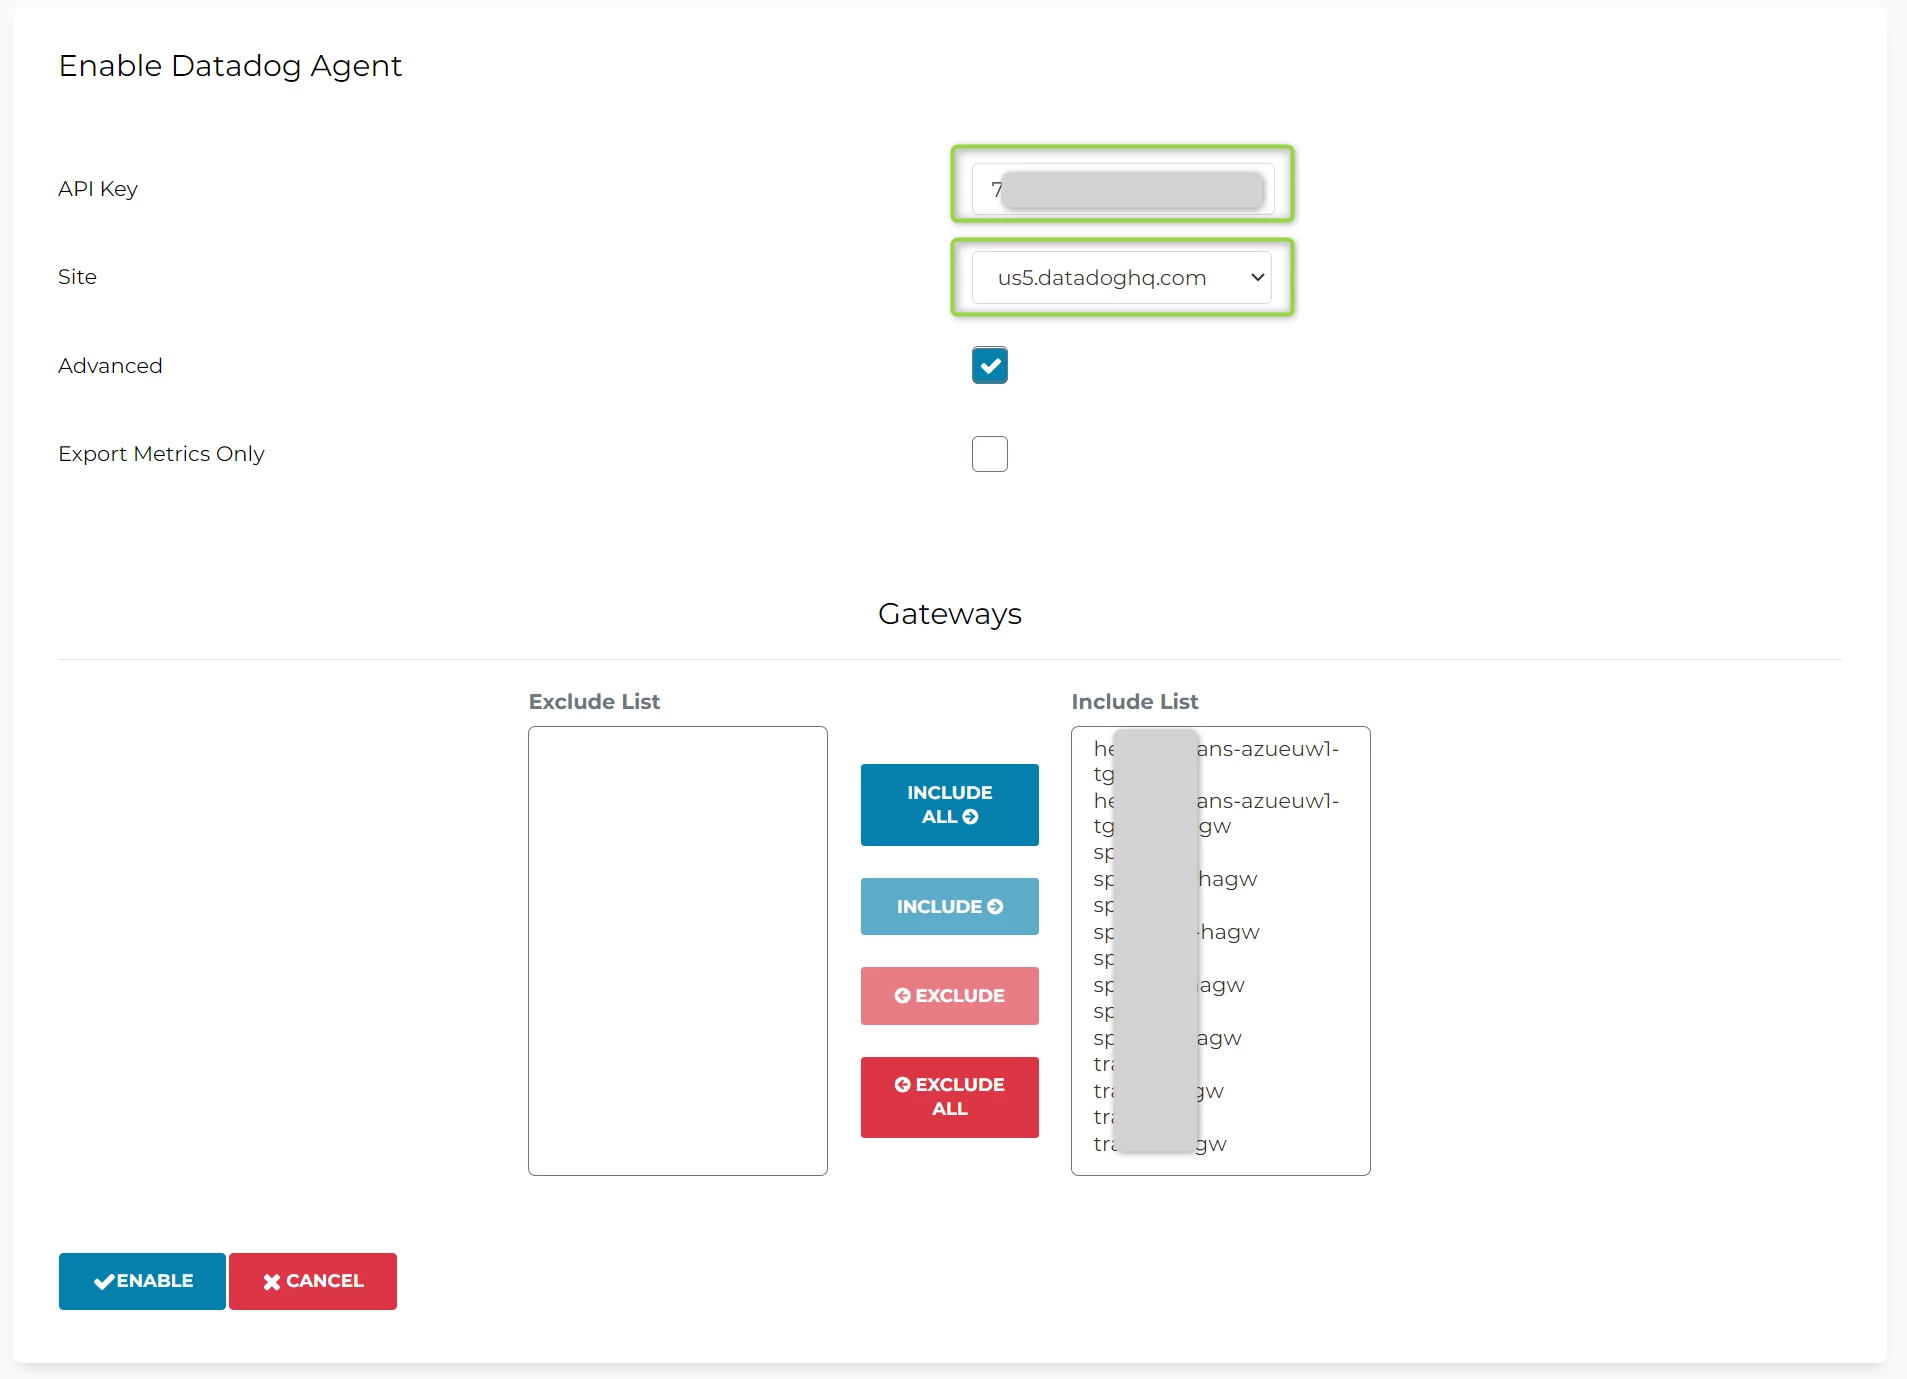
- Once done click “Enable”. It can take up to 1 minute to see the information that integration has been completed

Aviatrix CoPilot Configuration
In case you prefer setting up the integration using CoPilot (and not Controller) please follow the below steps:
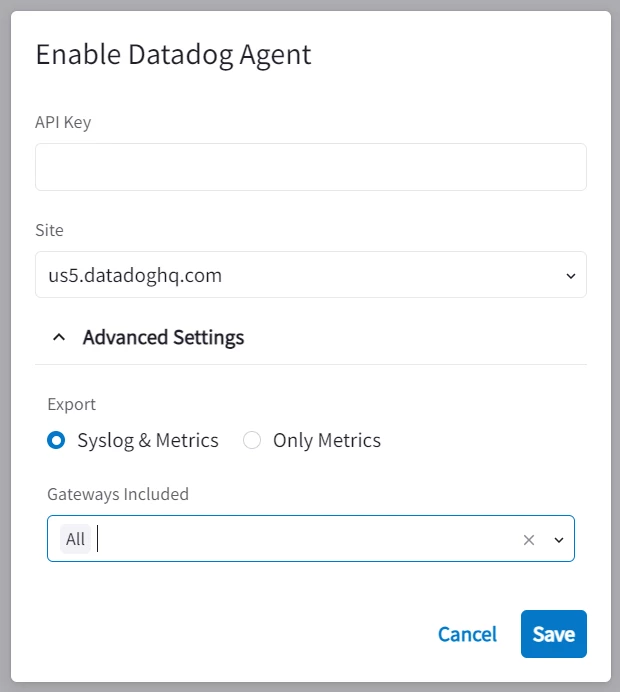
- Go to Settings -> Configuration -> Logging Services and Enable Datadog Agent
- Provide the required pieces of information:API Key
- API Key
- Site (please select the proper Datadog site)
3. If you click on “Advanced” additional options will appear:
- You can choose to export only Metrics and no Logs (“Export Metrics Only”)
- Or you can select what Gateways to include in the integration with Datadog
Checking Logs and Metrics in Datadog
- Observing the logs and metrics in Datadog
- To verify that Datadog Agent is running on Aviatrix Controller and Gateways go to Service Mgmt -> Event Management
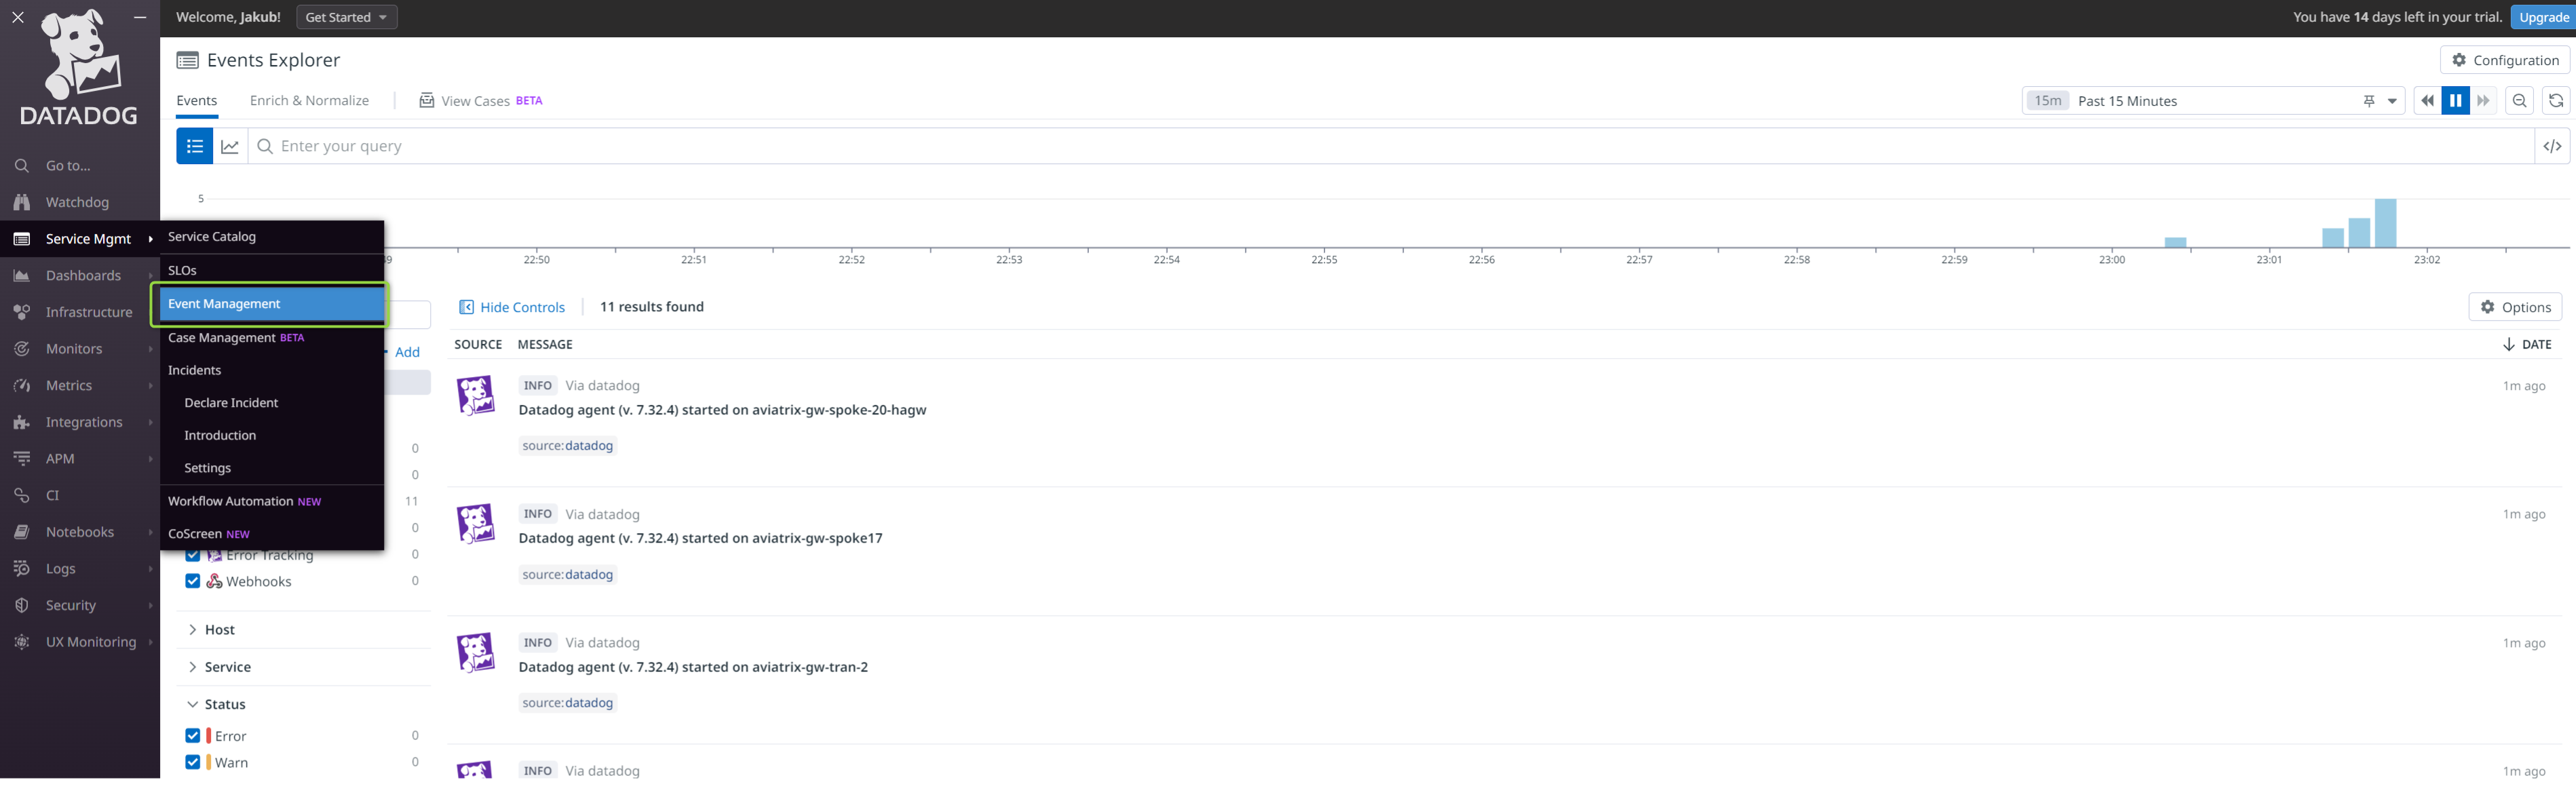
You can see the Datadog Agents installed on Aviatrix Controller and Gateways have been started.
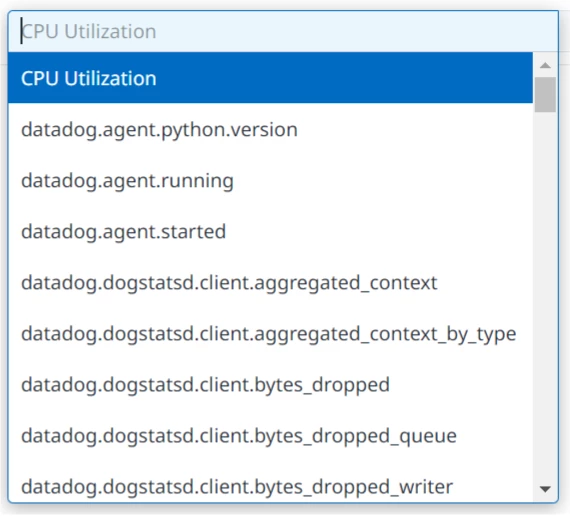
- To check Aviatrix Controller and Gateways Metrics go to Infrastructure -> Host Map
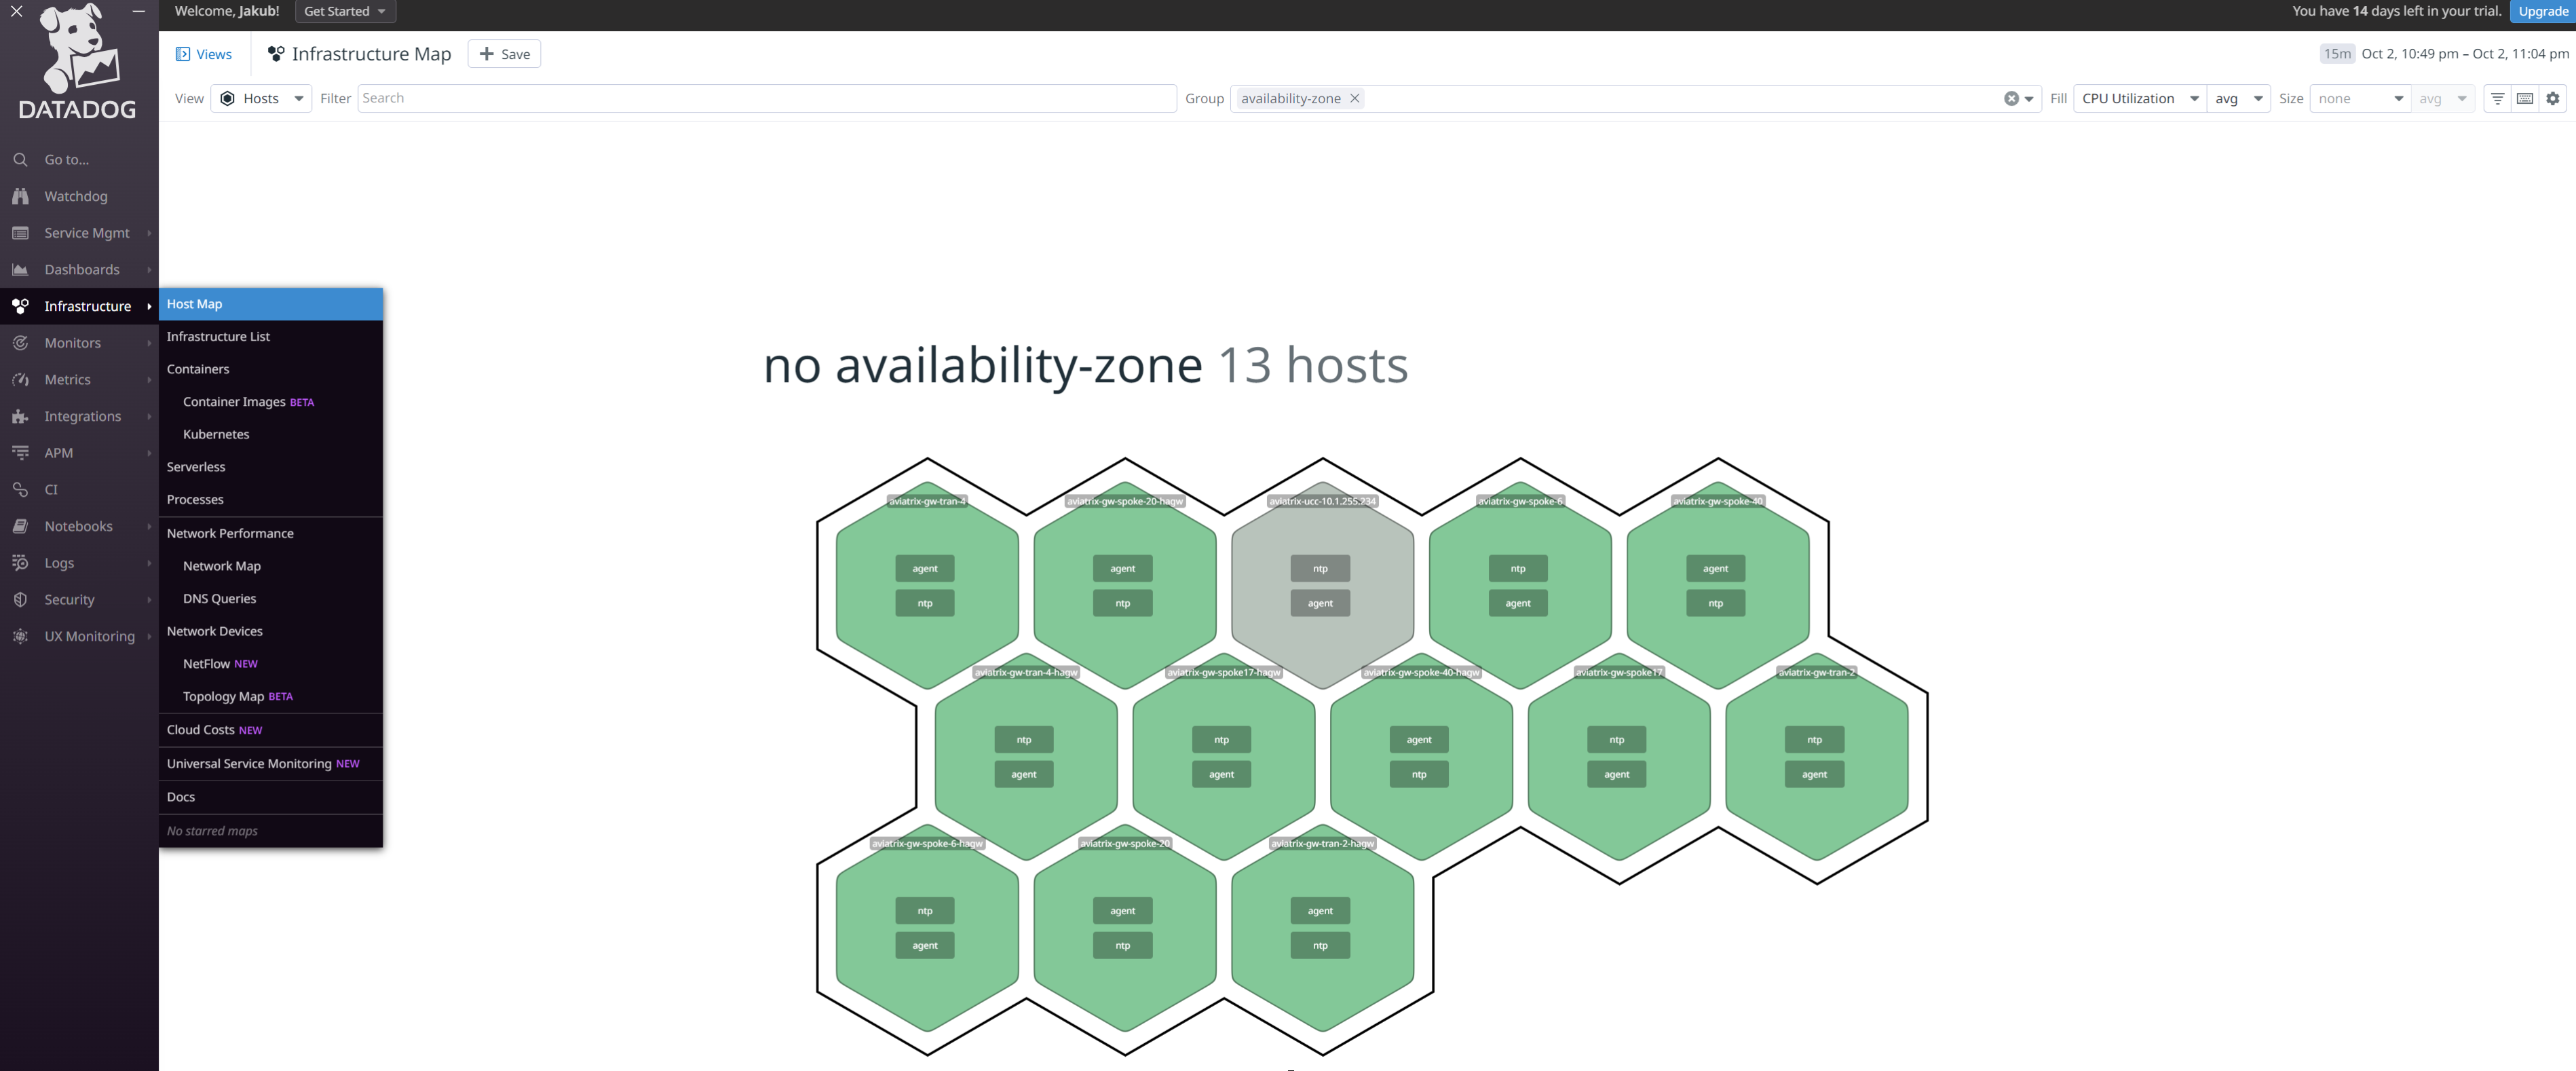
- You can check different types of Metrics incl. CPU Utilization and disk.used:
- To check Aviatrix Controller and Gateways Metrics go to Infrastructure -> Infrastructure List
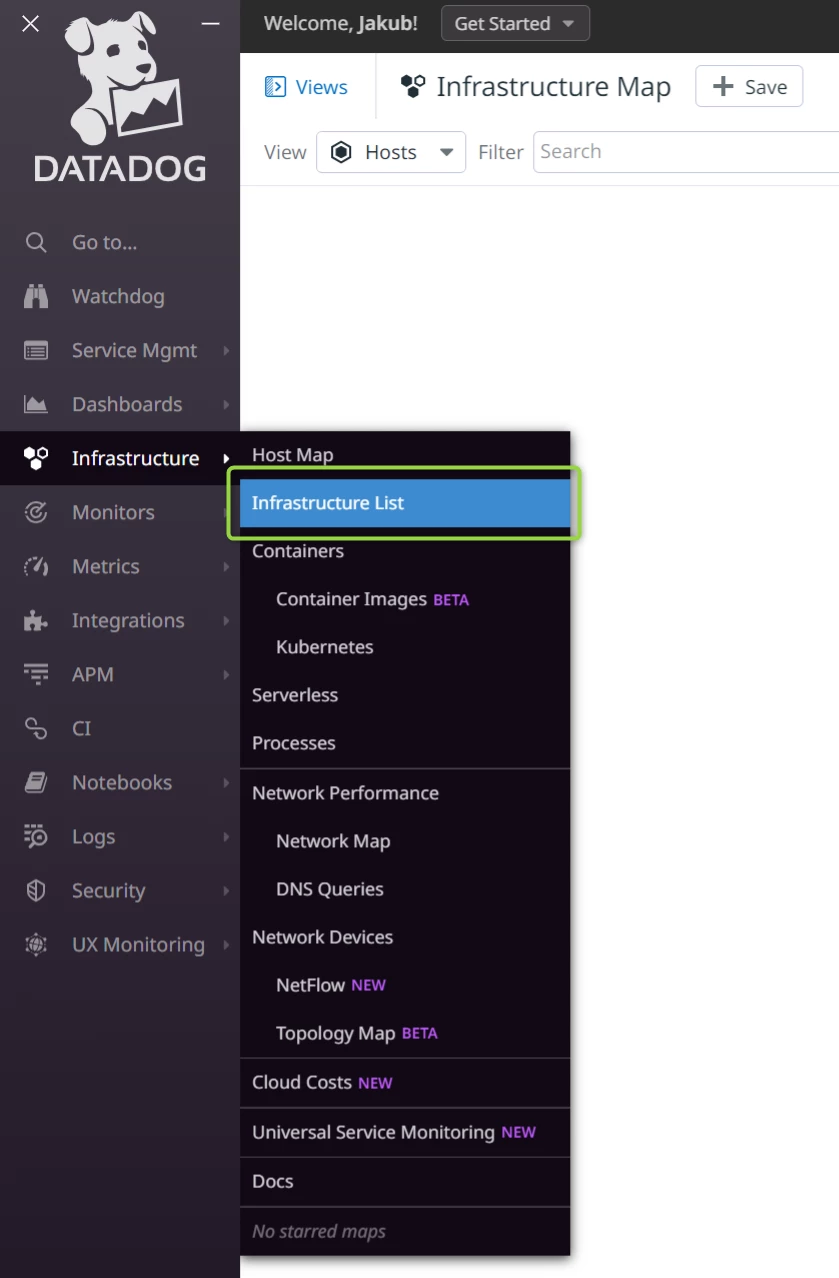
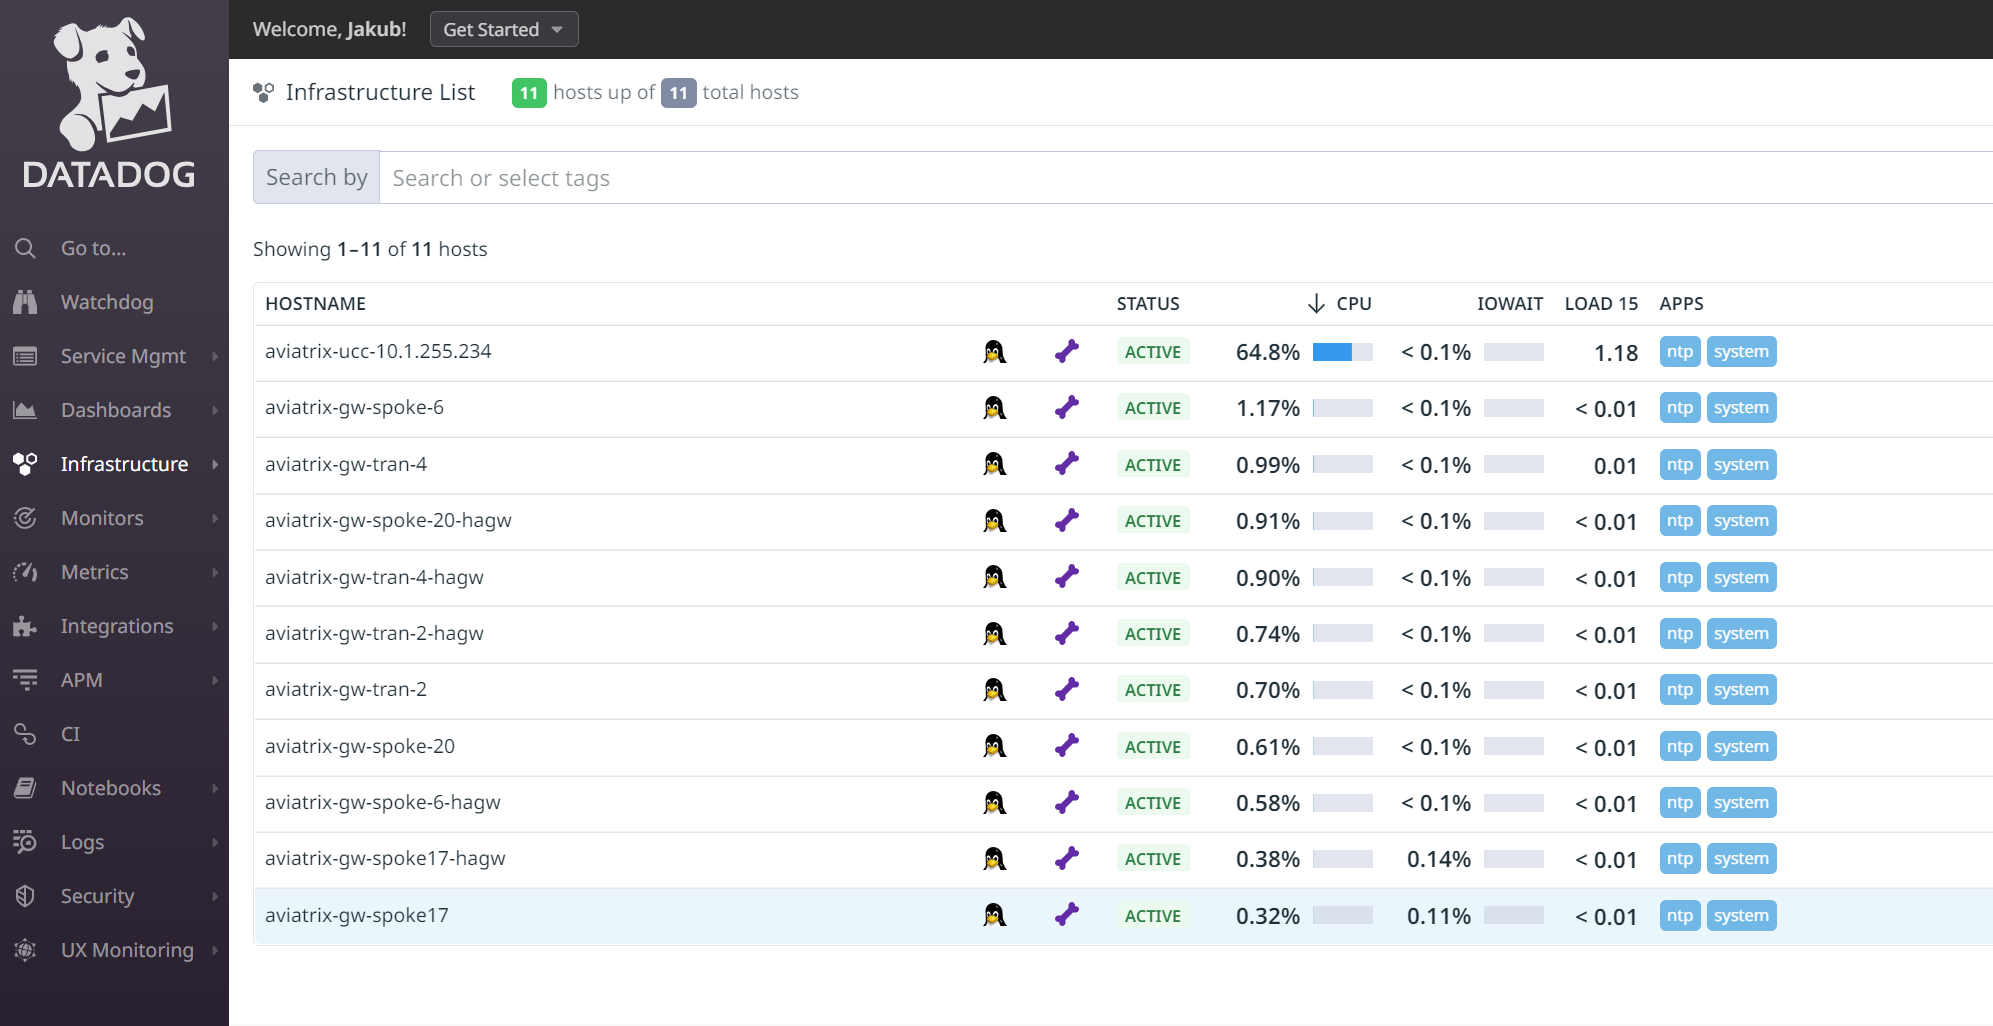
The host called “aviatrix-ucc-“ is Aviatrix Controller.
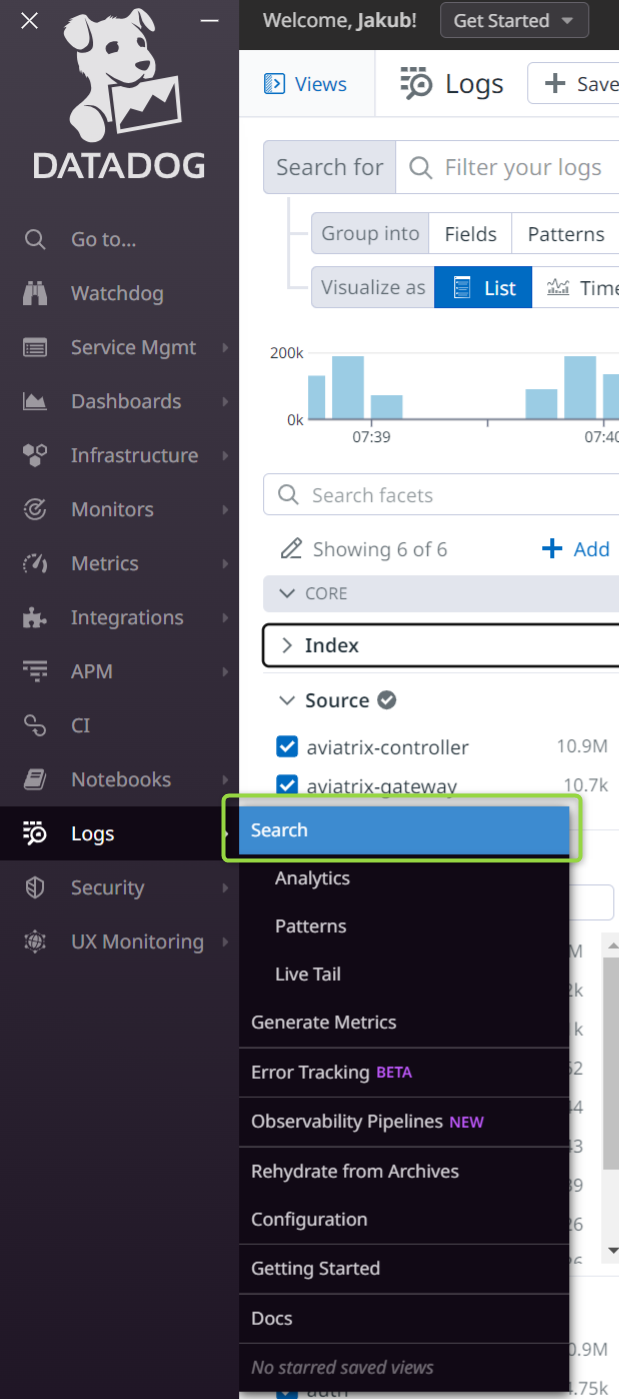
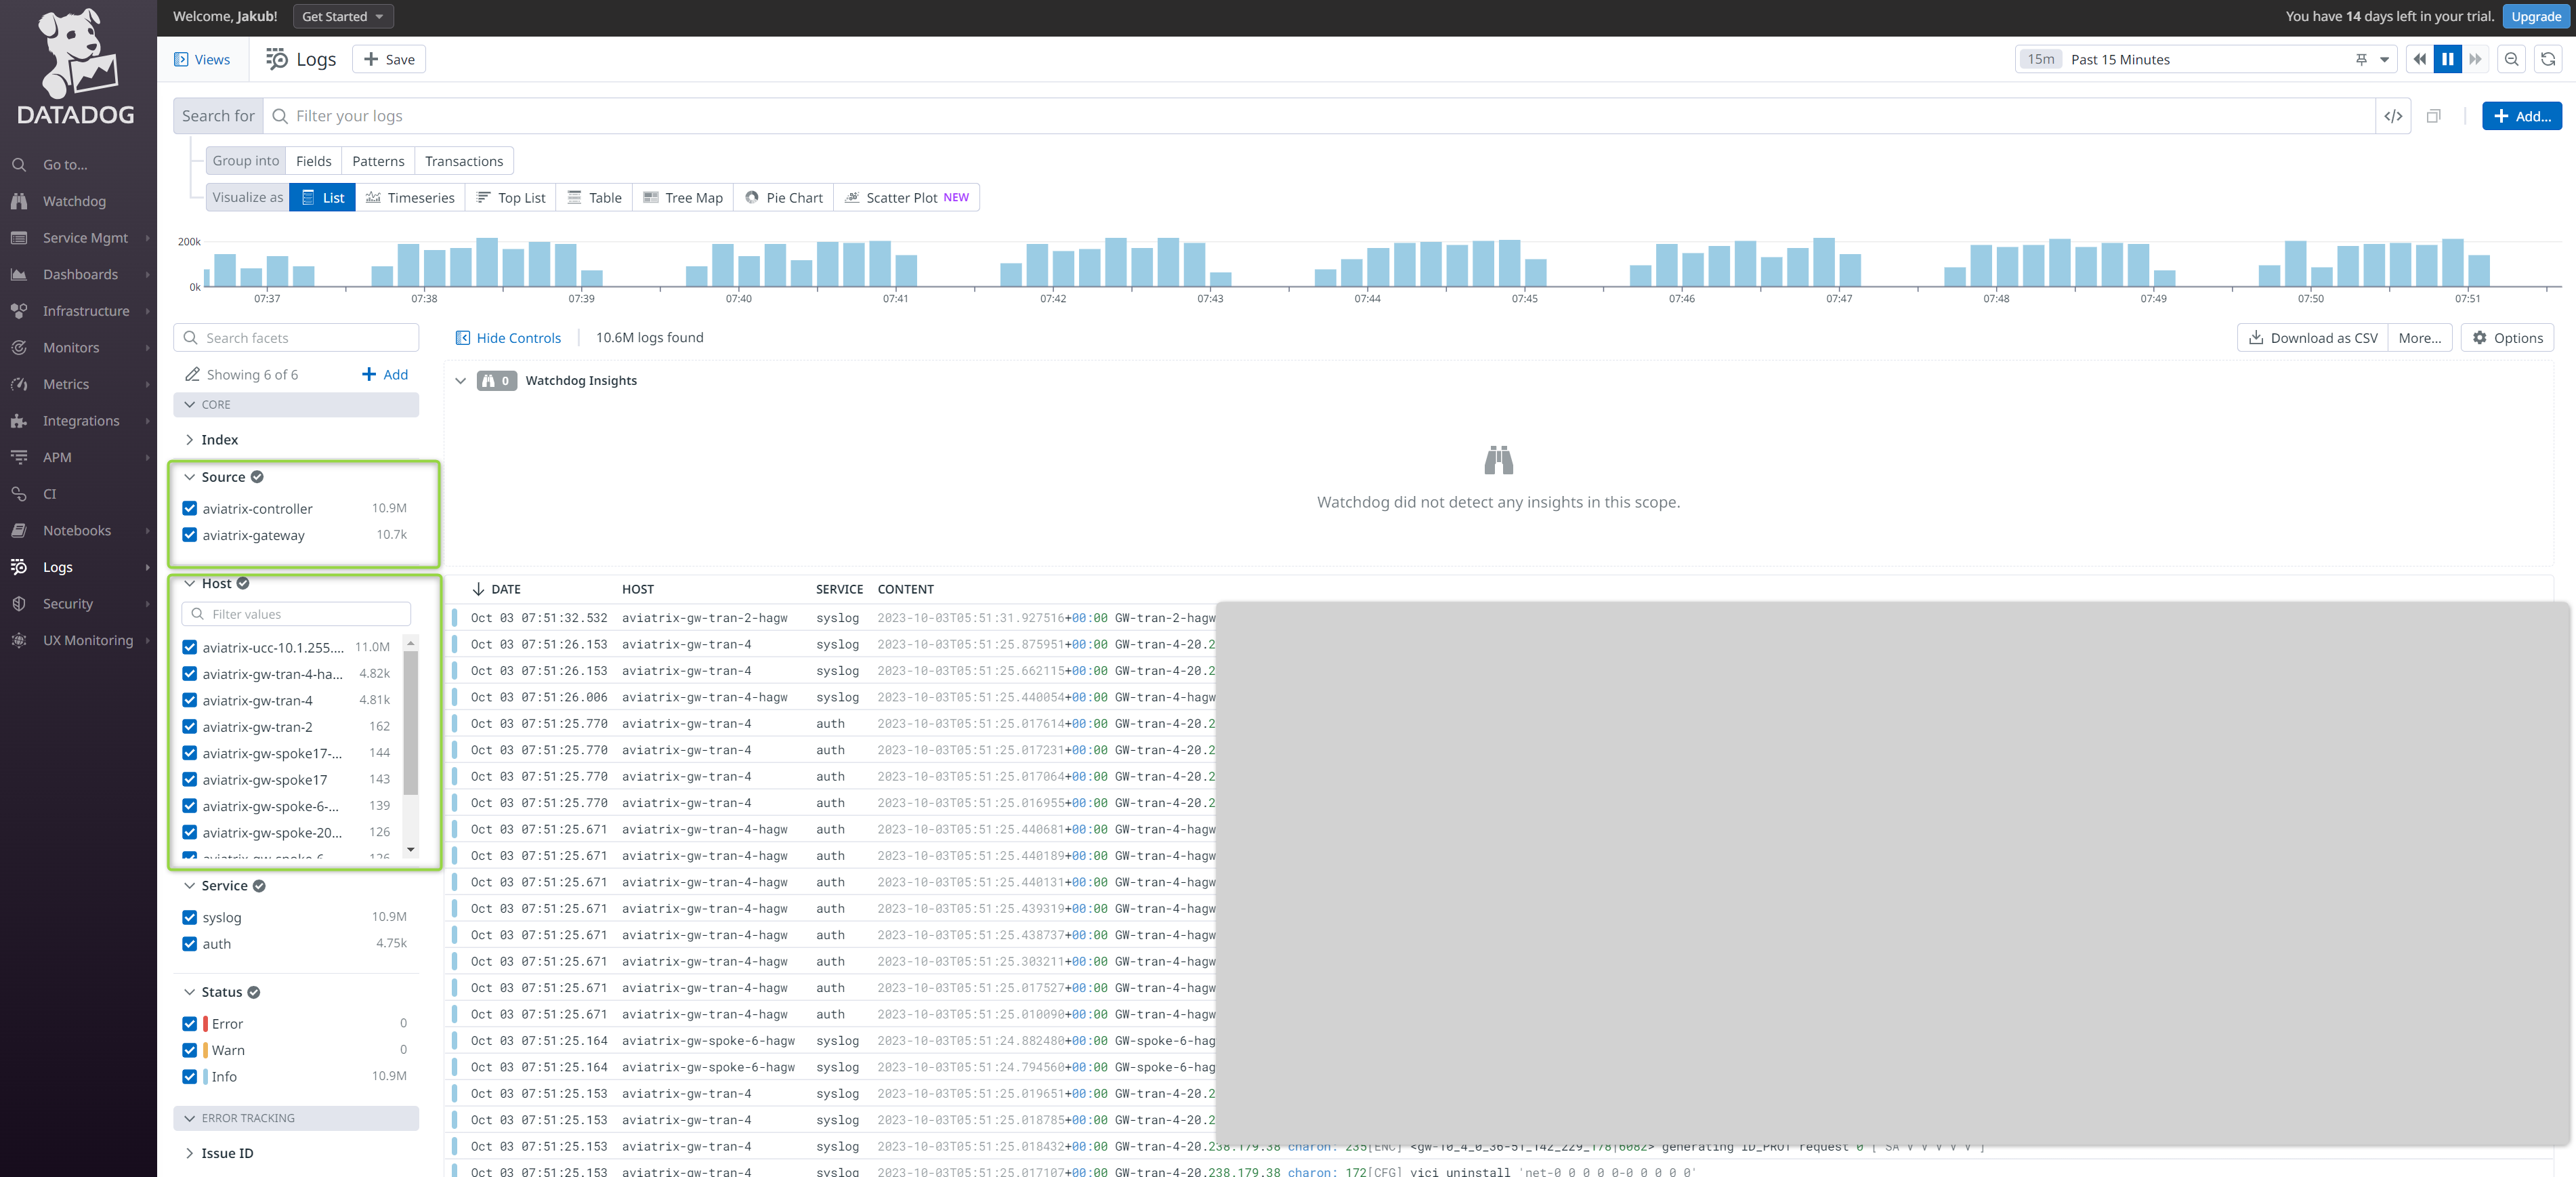
- To check Aviatrix Controller and Gateways Logs go to Logs -> Search
Aviatrix CoPilot Alerts
Aviatrix CoPilot can send their Alerts to other systems (e.g. Datadog) via Webhooks. There are two requirements to create such integration:
- Set up Webhook Recipient on Aviatrix CoPilot
- Create Endpoint URL (e.g. Datadog)
To set up Aviatrix CoPilot Webhook Recipient follow the steps below:
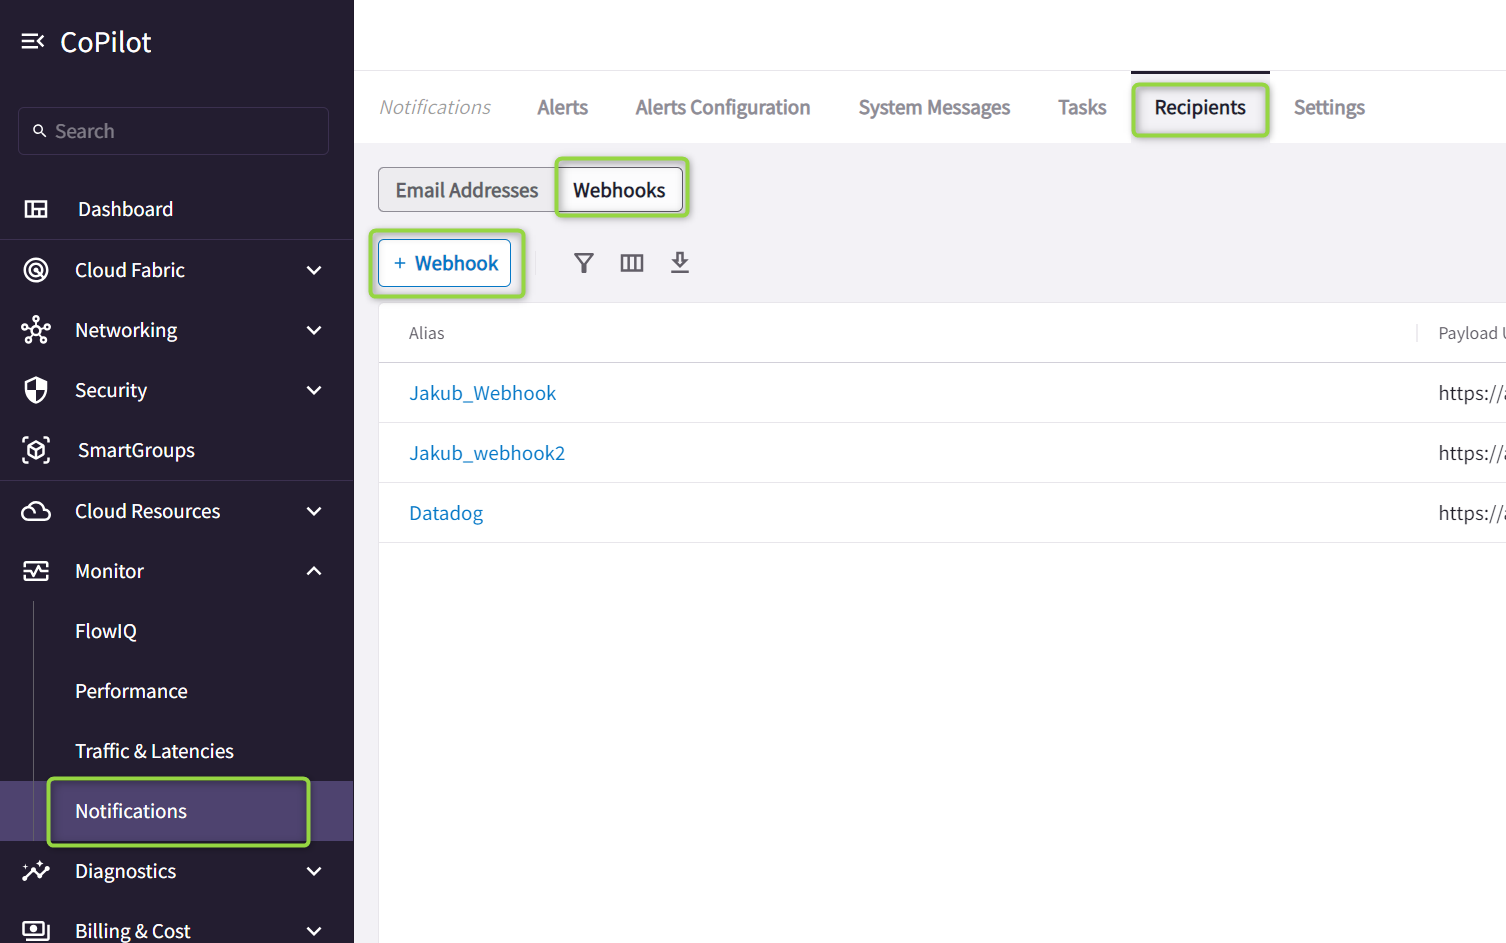
- Add the Recipient (go to Monitor -> Notifications -> Recipients -> Webhooks -> + Webhook)
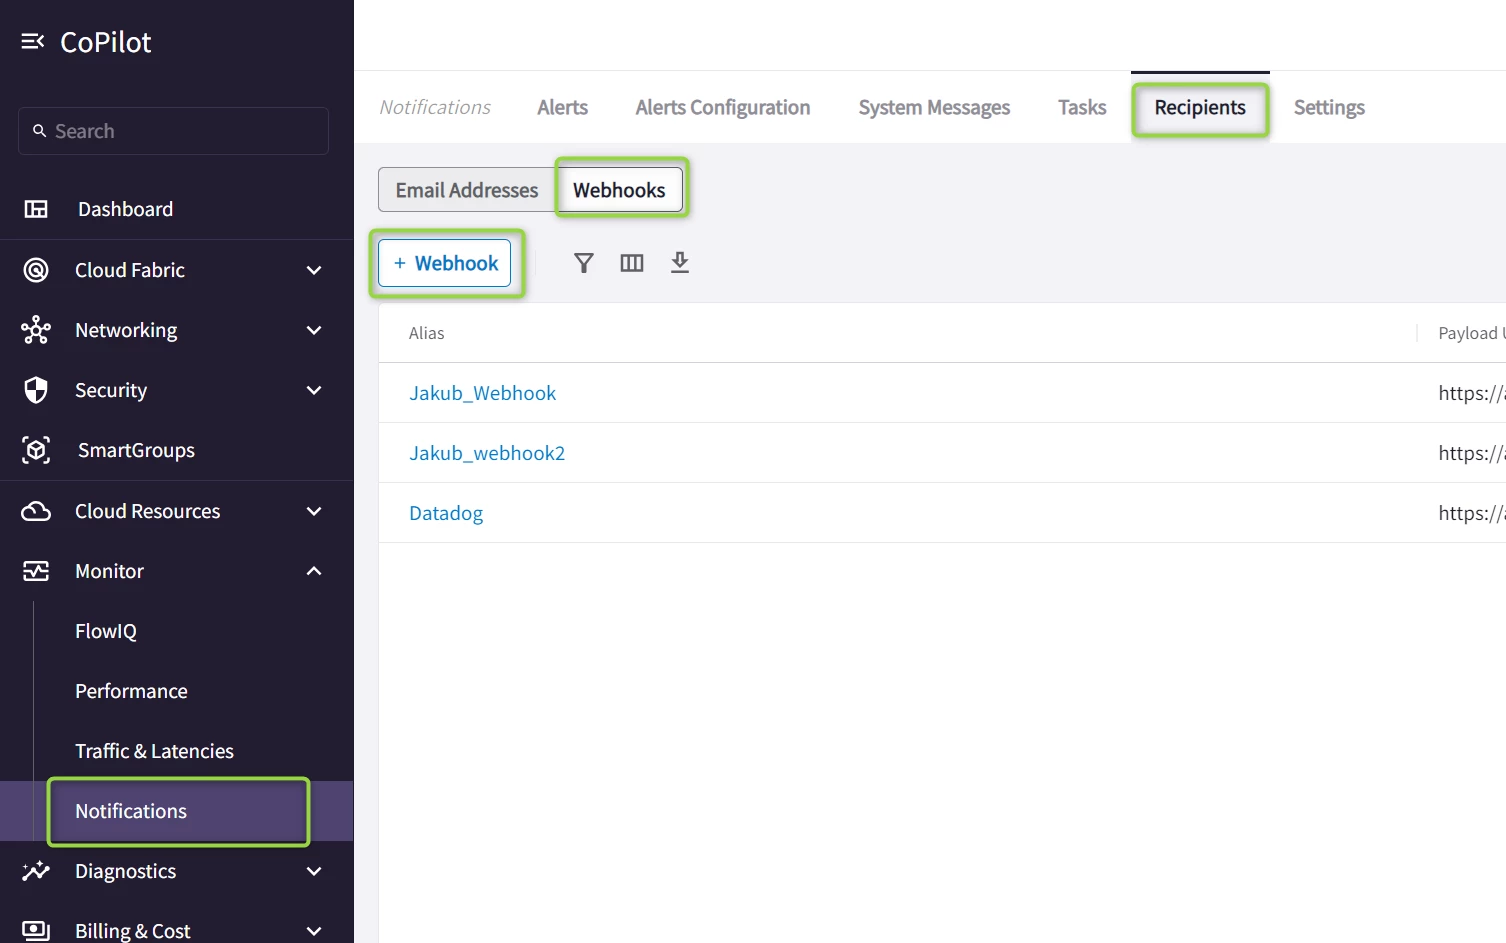
Specify the Alias, Payload URL, etc. Define the structure of the Template according to your requirements.
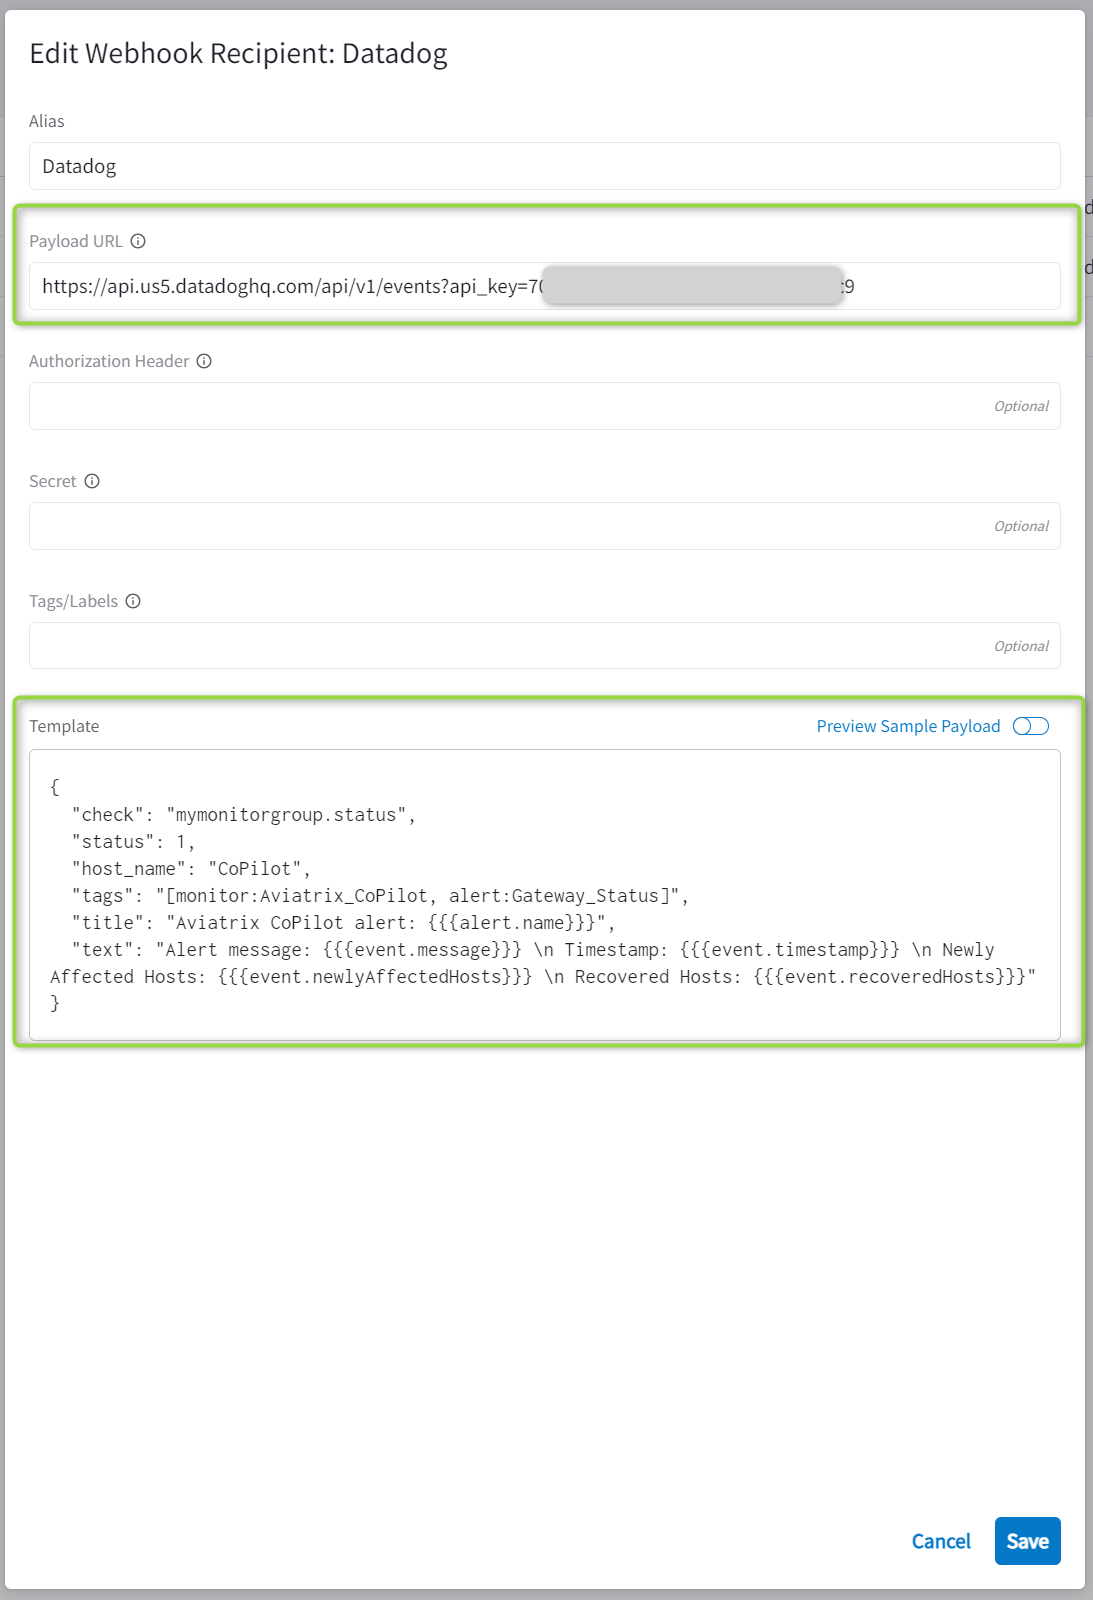
You can customize the template to include the Alert fields according to your requirements. The template shown here is just an example:
{
  "check": "mymonitorgroup.status",
  "status": 1,
  "host_name": "CoPilot",
  "tags": "[monitor:Aviatrix_CoPilot, alert:Gateway_Status]",
  "title": "Aviatrix CoPilot alert: {{{alert.name}}}",
  "text": "Alert message: {{{event.message}}} \n Timestamp: {{{event.timestamp}}} \n Newly Affected Hosts: {{{event.newlyAffectedHosts}}} \n Recovered Hosts: {{{event.recoveredHosts}}}"
}
Please notice that you must use the proper Payload URL depending on your Datadog site, e.g. for us5 it is going to be https://api.us5.datadoghq.com
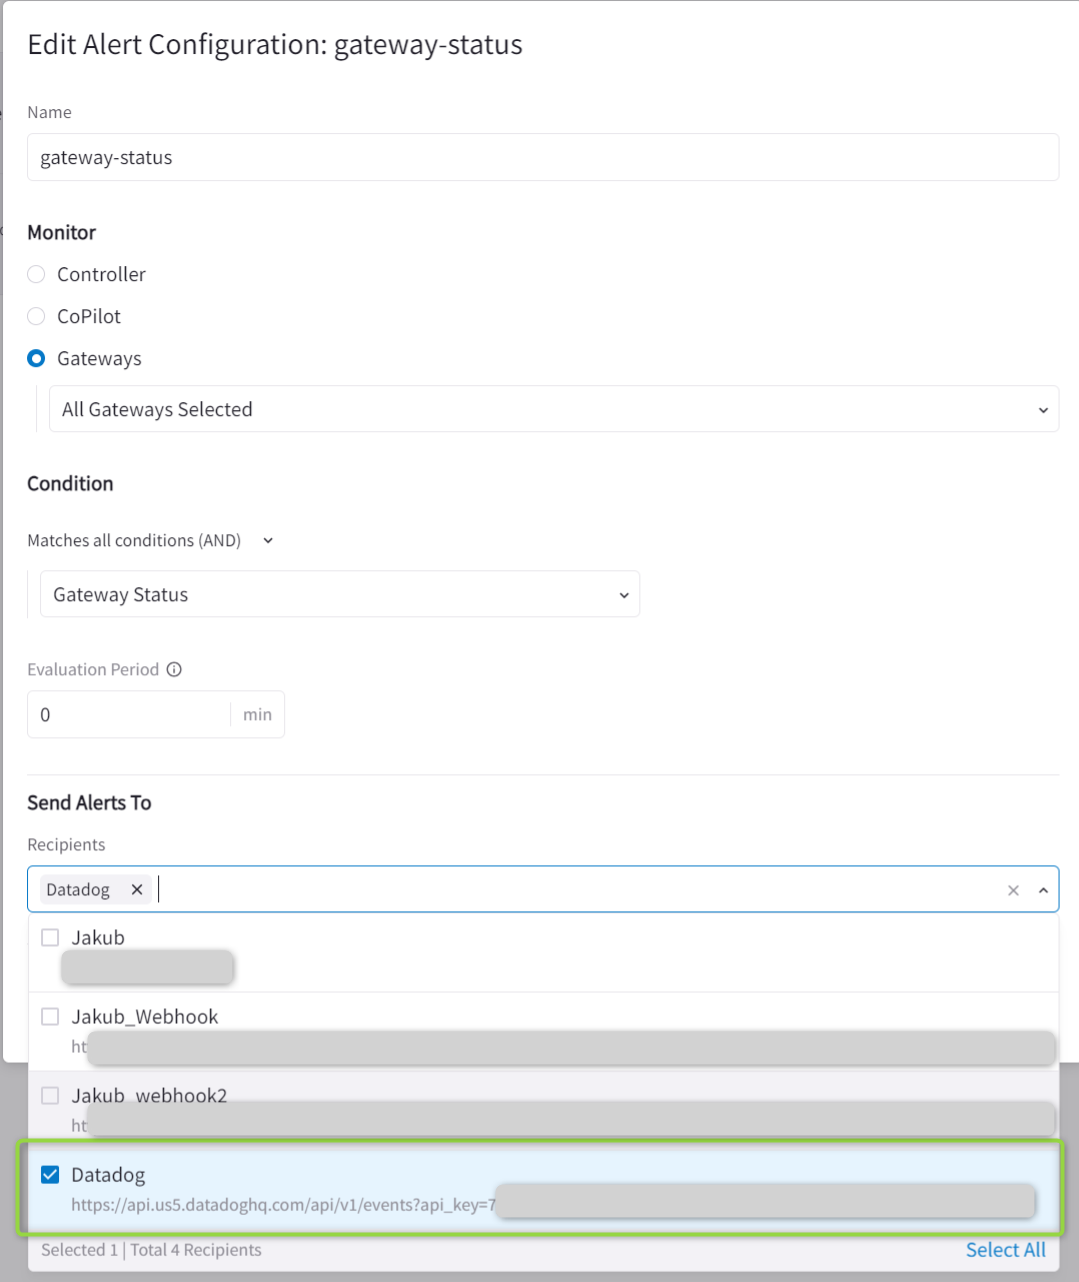
2. Create the Alert (Monitor -> Notifications -> Alerts Configuration)
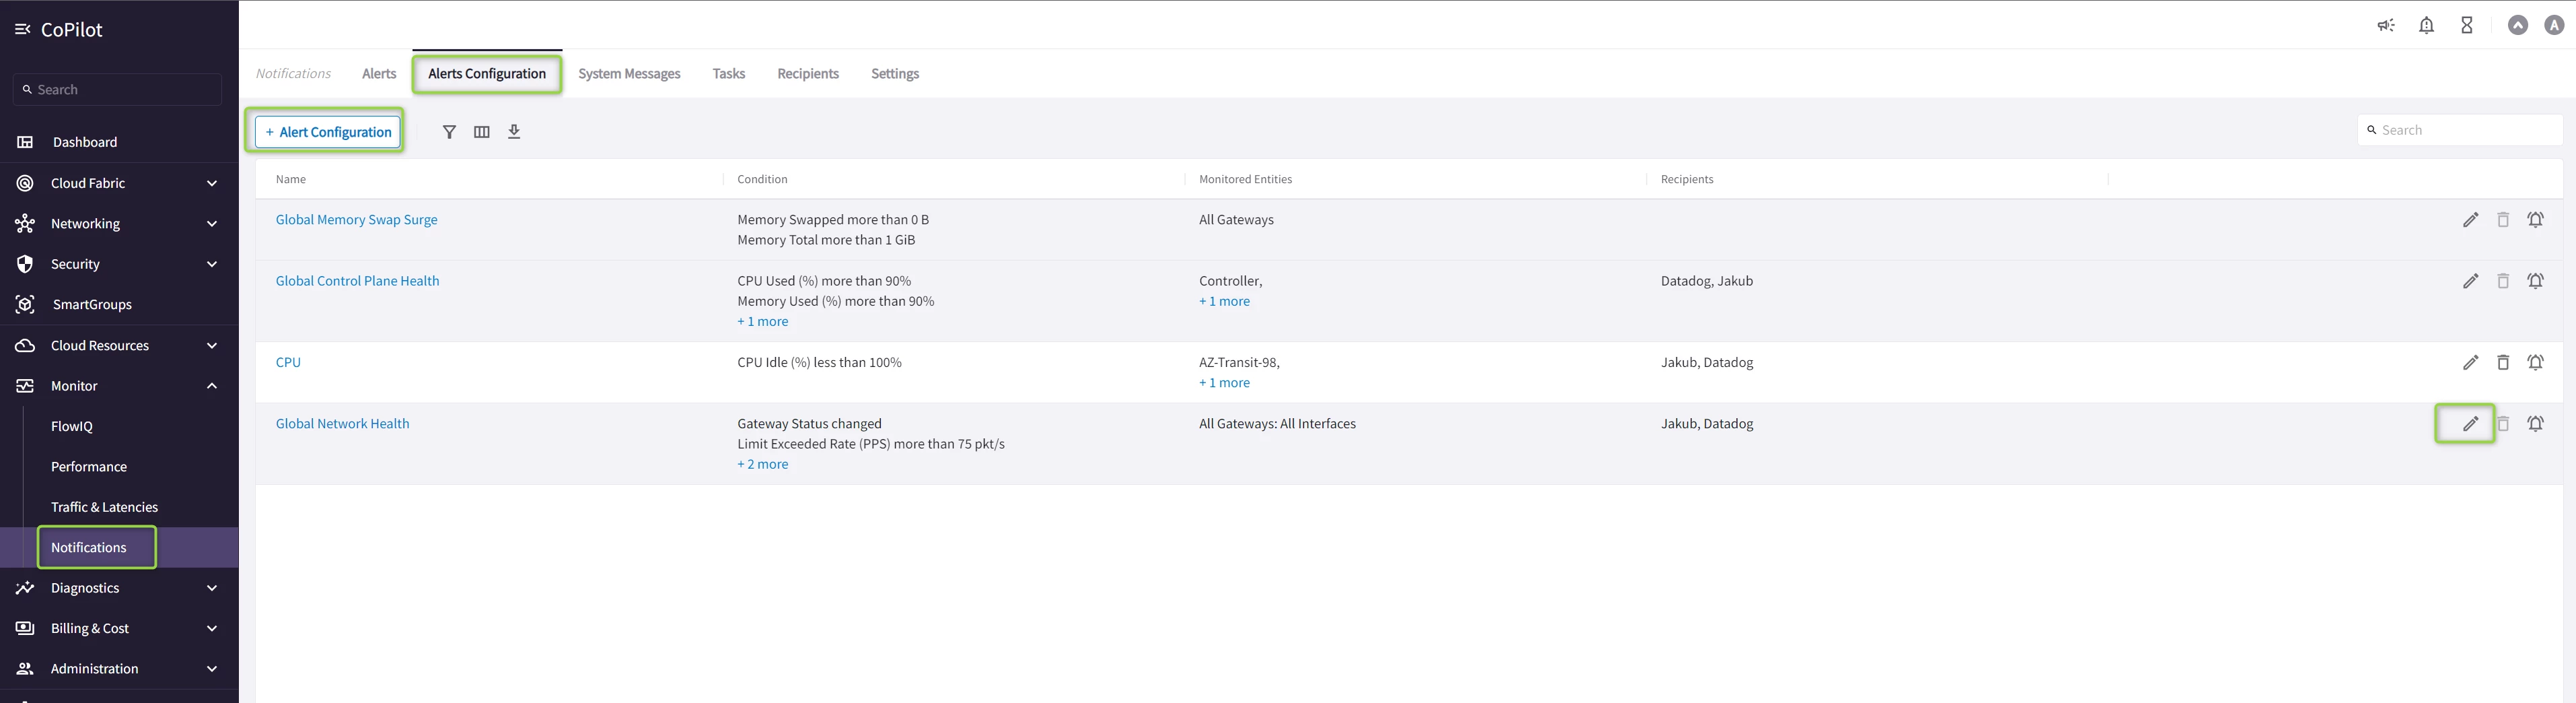
You can either create a new alert (+ Alert Configuration) or Edit the existing one. Select as a “Send Alerts To” the Webhook you created in the previous step. Save the changes
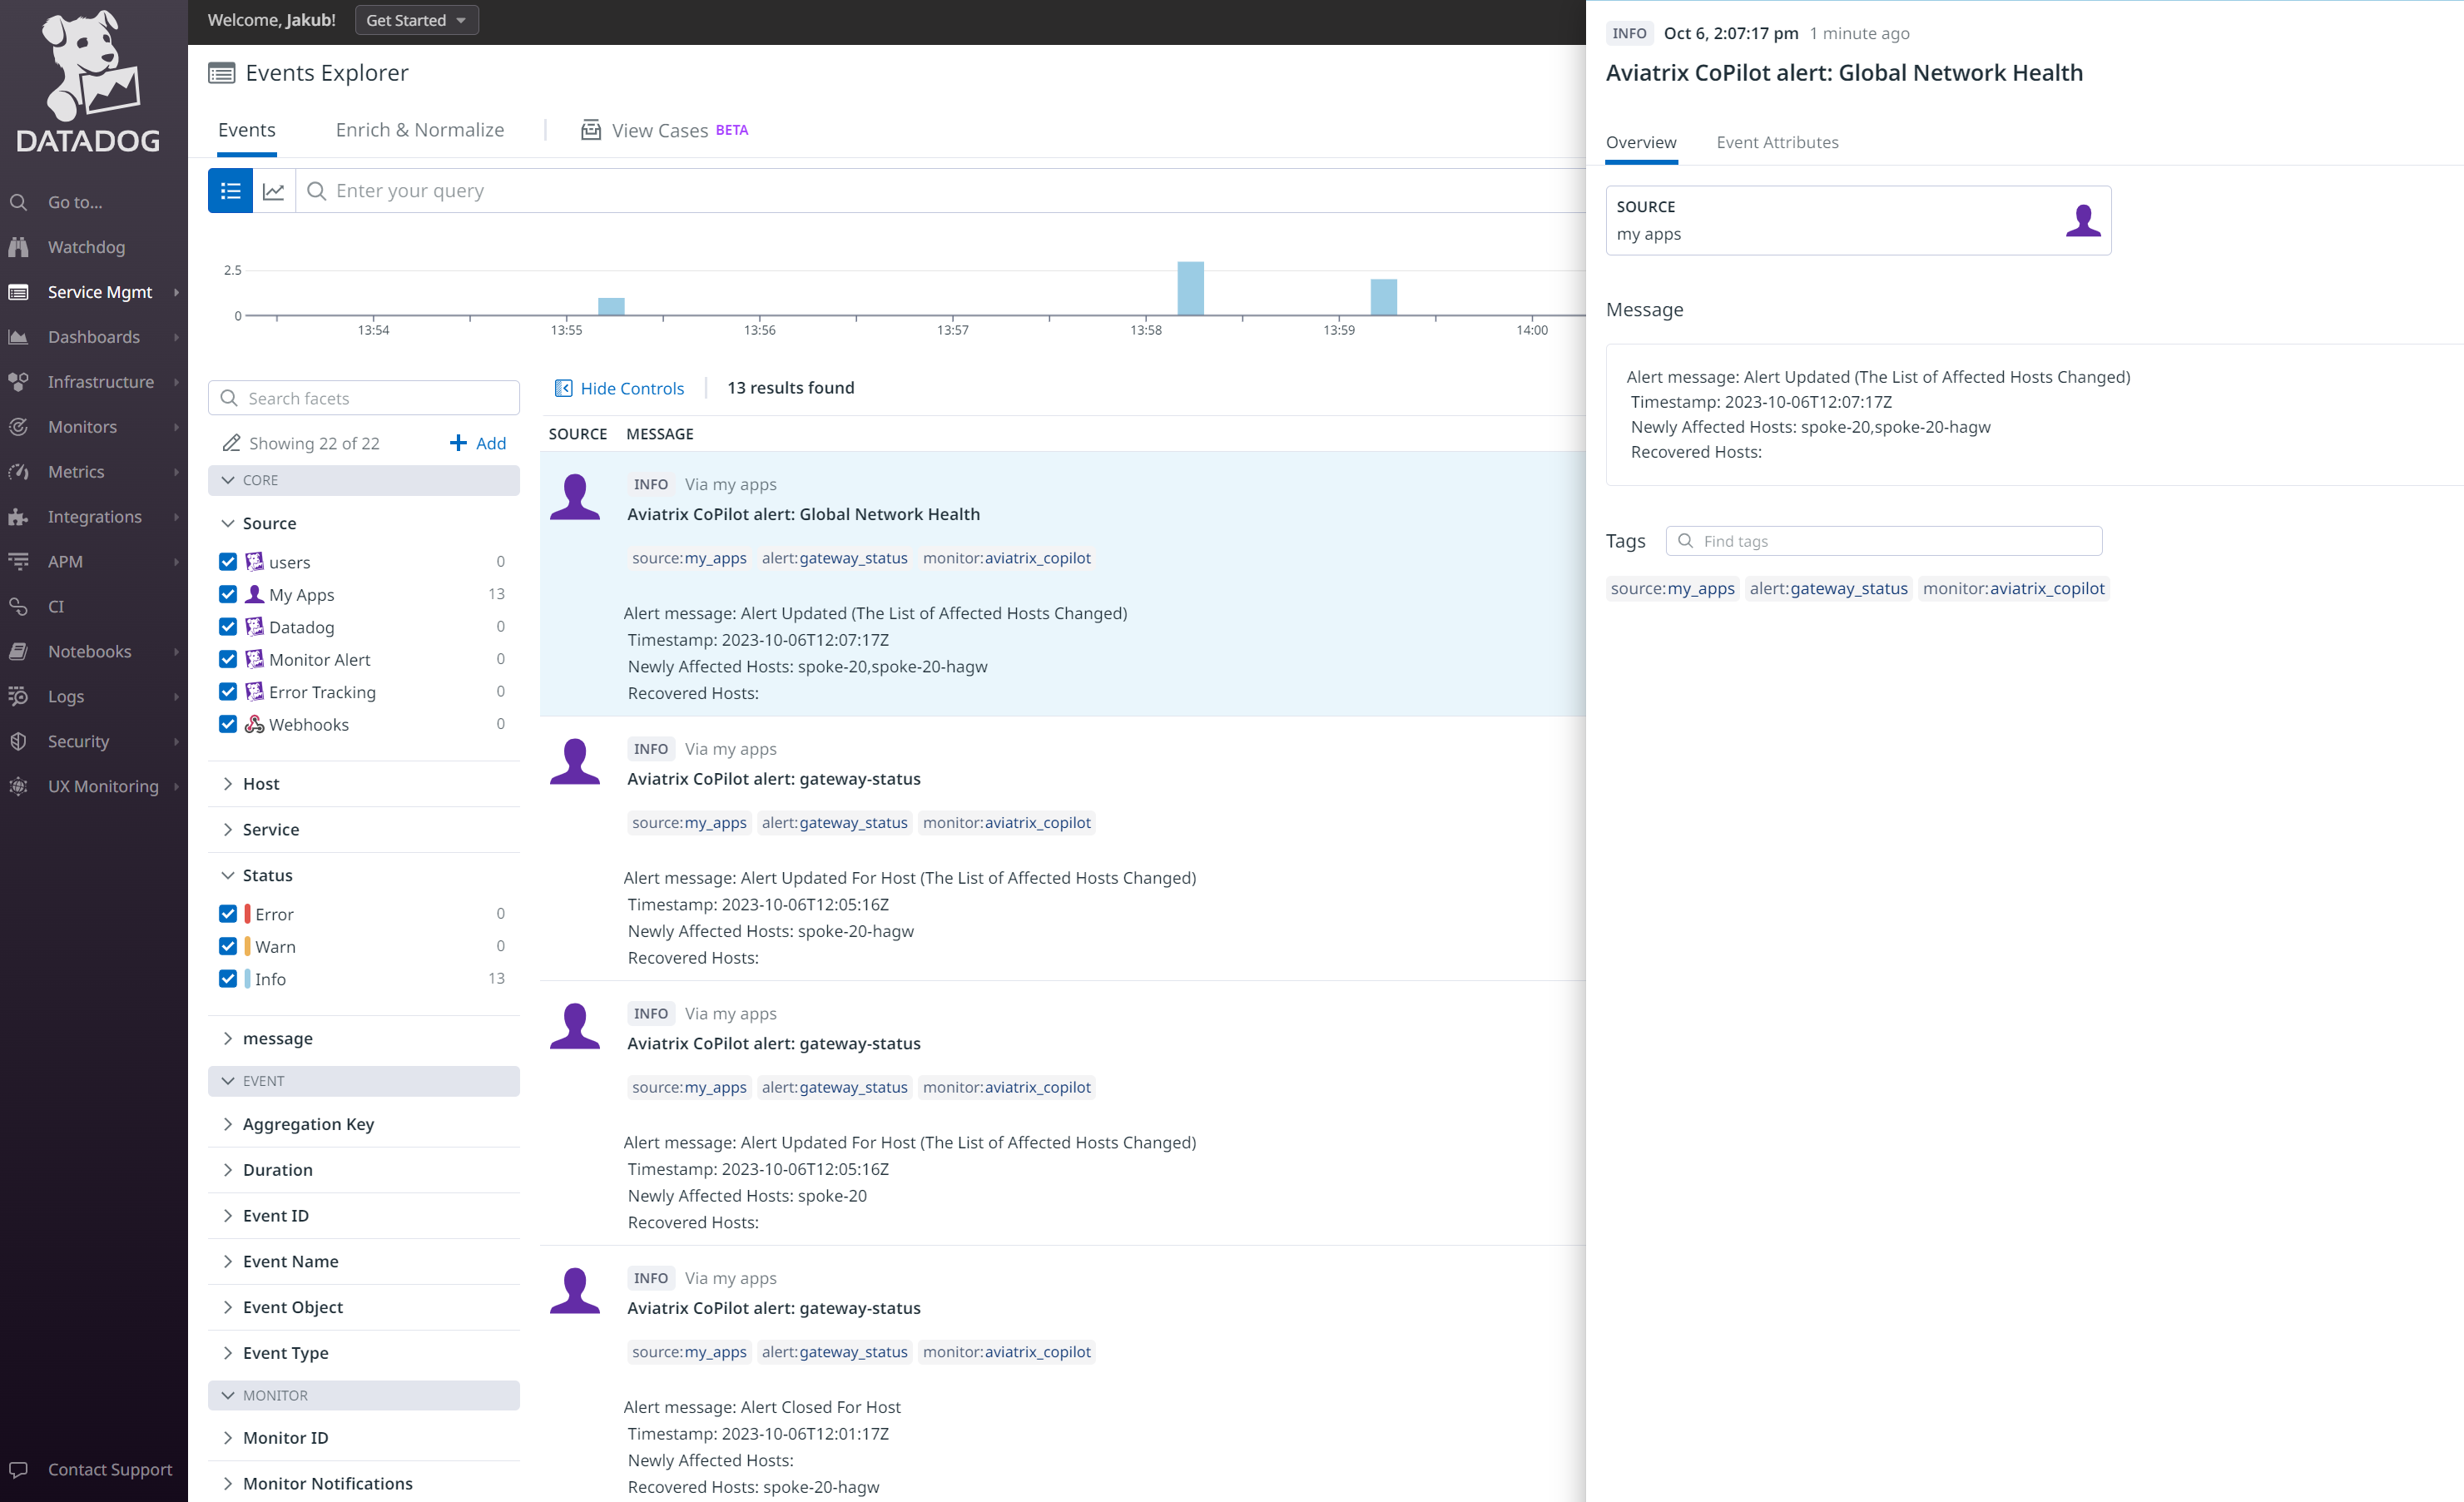
Checking Alerts in Datadog
Go to Service Mgmt -> Event Management tab to check the alerts sent by CoPilot to Datadog via Webhook. Depending on the setup on CoPilot Alert Configuration the type of Alerts you see will be different.
Useful Links
Datadog:
https://docs.datadoghq.com/developers/guide/calling-on-datadog-s-api-with-the-webhooks-integration/
https://docs.datadoghq.com/api/latest/
https://docs.datadoghq.com/service_management/events/
Aviatrix:
https://docs.aviatrix.com/copilot/latest/monitoring-troubleshooting/notifs-webhook.html
More about Networking in the Cloud and Aviatrix: https://cloud-cod.com/