

Introduction
This article presents how to integrate Aviatrix CoPilot with Prometheus and Grafana.
The design provided here guides you on how to create a centralized monitoring solution for your environment. Having that allows you to gain full visibility of your Aviatrix and non-Aviatrix environments/applications integrated into one monitoring system to quickly identify the health (errors, bottlenecks, etc.) of all of your resources. What is more, it gives you the visibility of your entire environment.
What is Prometheus
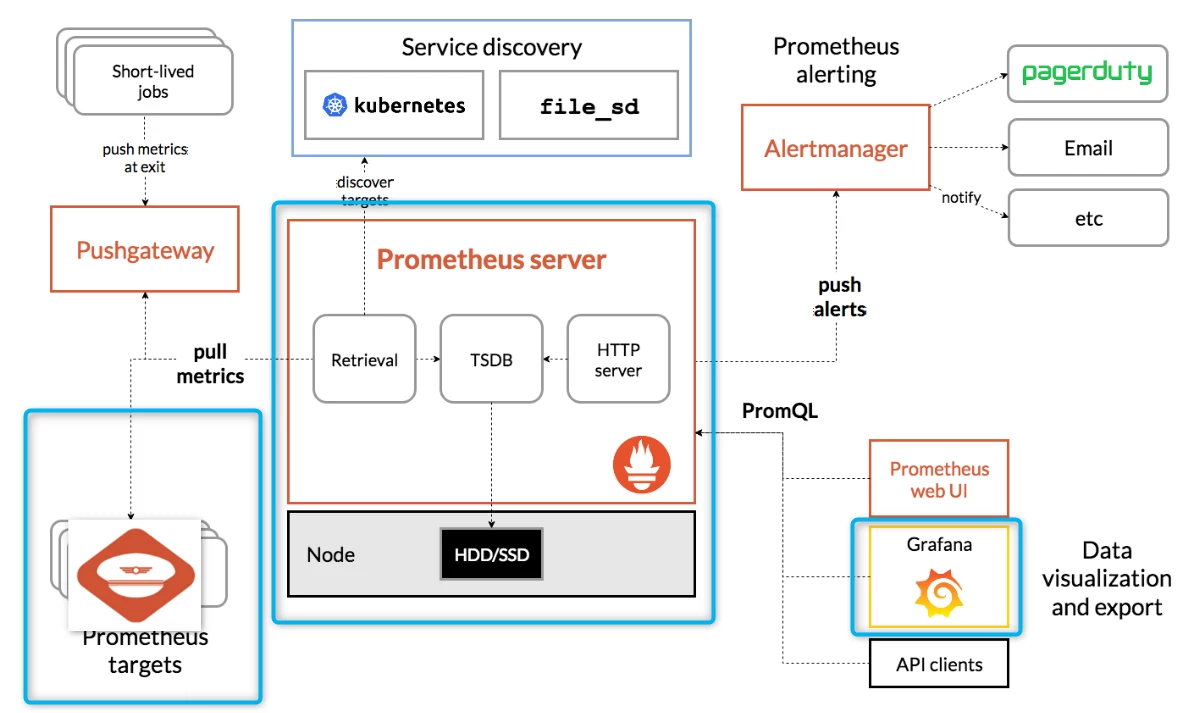
Prometheus is an open-source monitoring and alerting system. Prometheus pulls the metrics from different Targets (API calls). Those Targets are specified in the Prometheus configuration file. Prometheus will initiate the connection with all the Targets and scrape the metrics at specific intervals. In our case, Aviatrix CoPilot will be the Target.
According to https://prometheus.io/docs/introduction/overview/ “Prometheus collects and stores its metrics as time series data, i.e. metrics information is stored with the timestamp at which it was recorded, alongside optional key-value pairs called labels”.
One important note is that the Prometheus job is querying the data and storing it. It is not for visualizing anything. This is where Grafana plays its role.
Prometheus has its Alertmanager that can be set up to send the Alerts (Email Notifications) based on specific events. However, I will not dig into that in this article.
What is Grafana
Grafana ( https://grafana.com/ ) is an open-source tool (WebUI) that provides interactive data/metrics analysis and visualization. The user can create fully customizable dashboards and share them with other people. Grafana is using PromQL to query the metrics from the Prometheus server.
Aviatrix integration with Prometheus and Grafana
The diagram below presents the integration between Aviatrix CoPilot, Prometheus, and Grafana (image taken from https://prometheus.io/docs/introduction/overview/ and modified by me).
Aviatrix CoPilot Metrics API
UPDATE: Please keep in mind that the CoPilot Metrics API has been updated and renamed. The new name is “Network Insights API”. The following documentation link guides you on how to enable it:
https://docs.aviatrix.com/documentation/latest/monitoring/metrics-api-enable.html#enabling-the-network-insights-api
The Aviatrix CoPilot Metrics API (https://docs.aviatrix.com/copilot/latest/monitoring-troubleshooting/metrics-api-enable.html) allows you to retrieve metrics for your Aviatrix Controller and Aviatrix Gateways. There are two types of Collections you can use:
- Status API
- Metrics API
Please follow the steps below to activate Metrics API and Download the Collections:
-
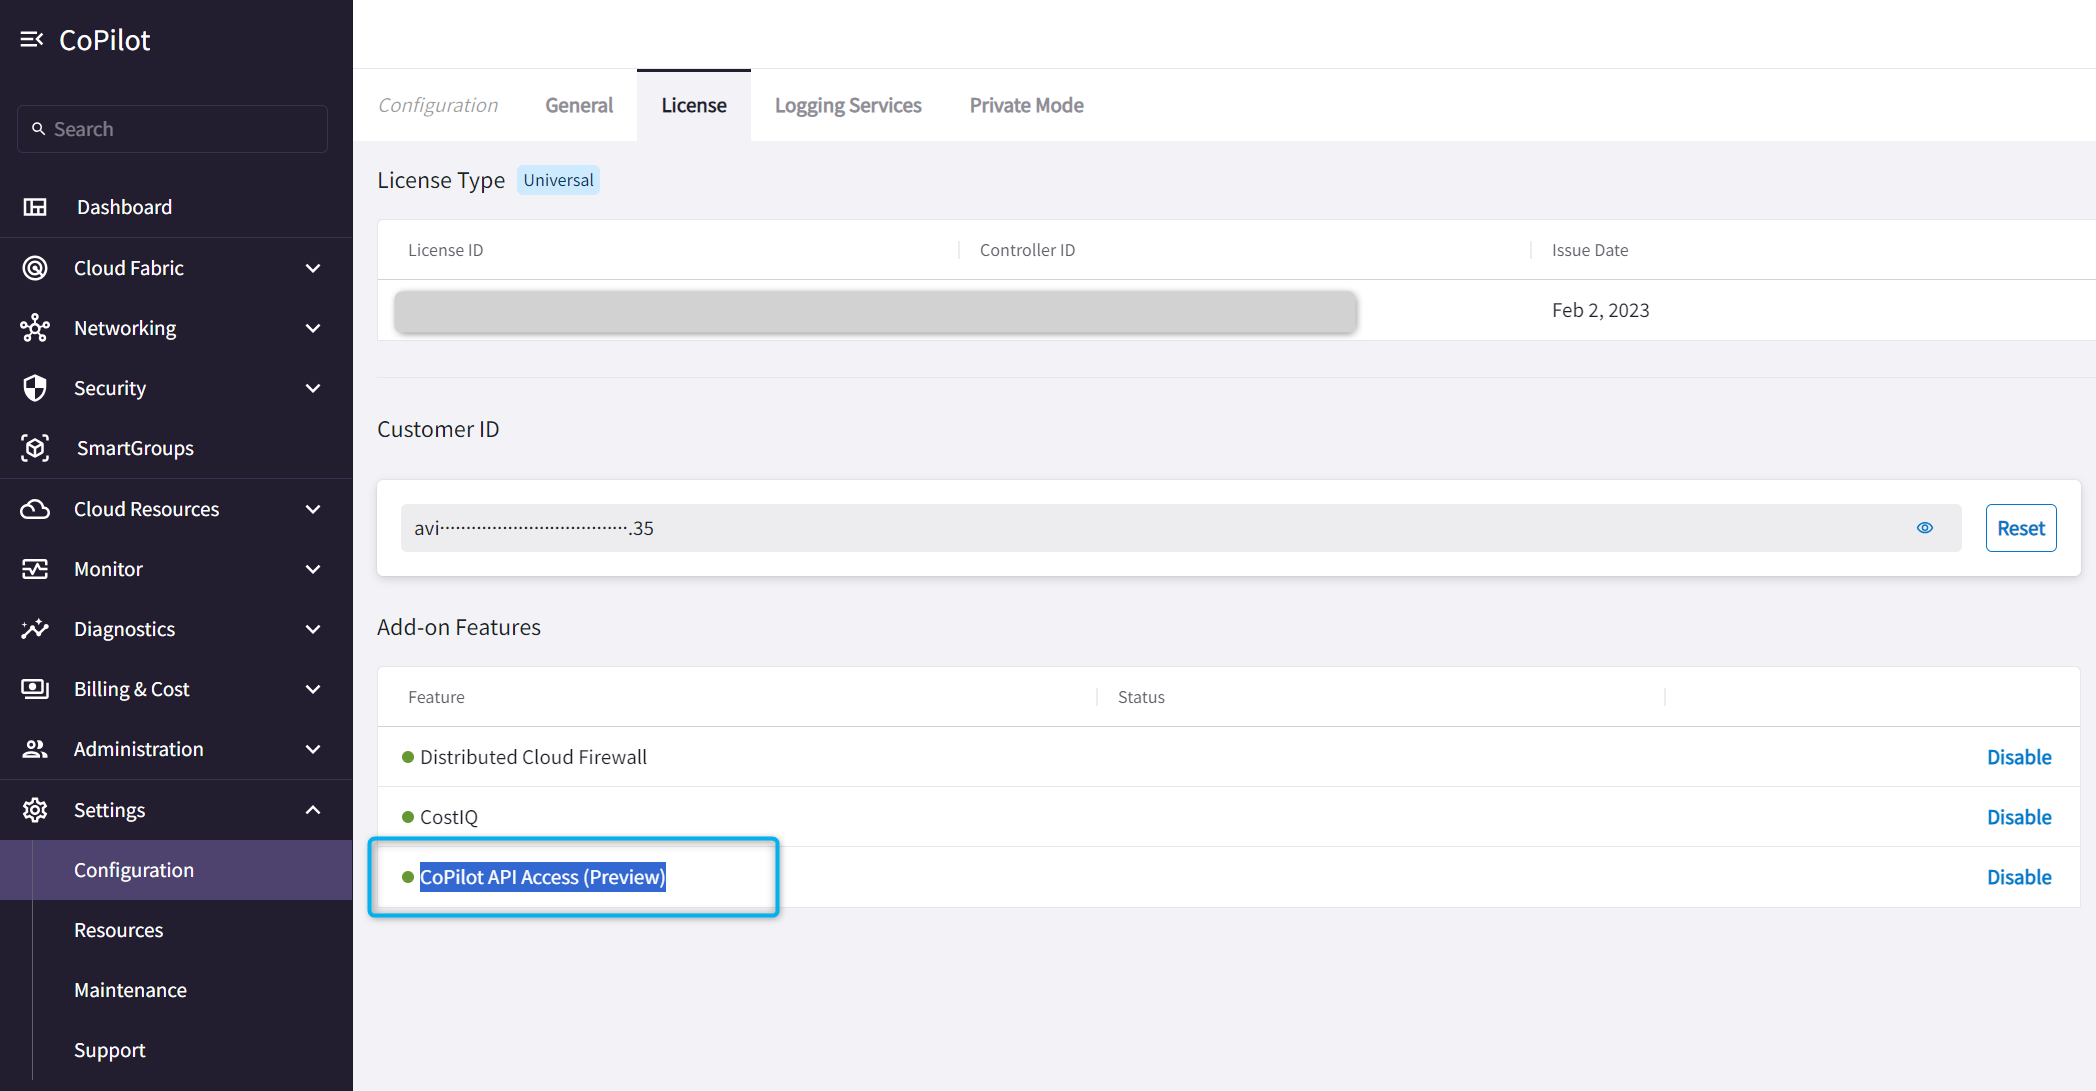
Go to CoPilot > Settings > Configuration > License and confirm the CoPilot API Access under Add-on Features is enabled
-
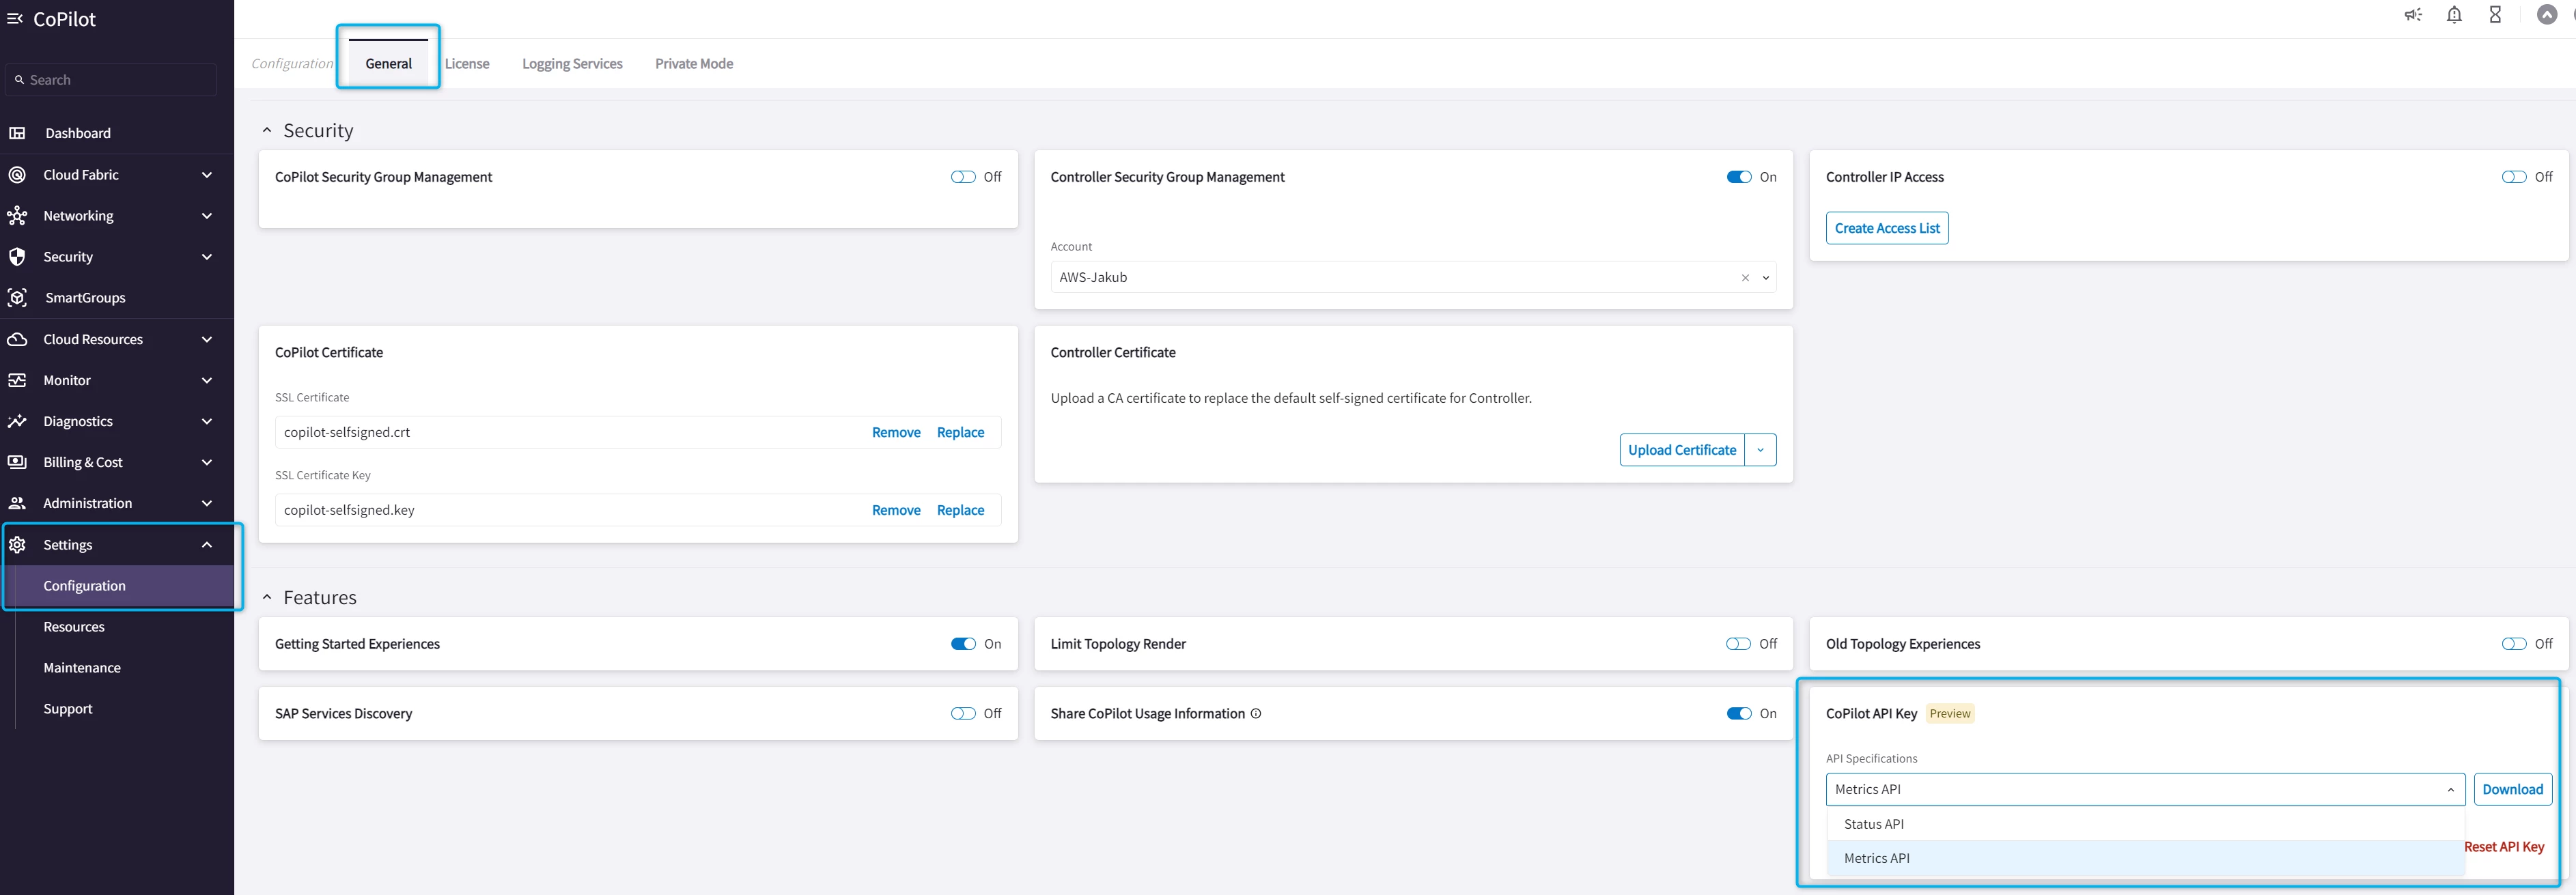
Go to CoPilot > Settings > Configuration > General and Reset the API Key if needed
-
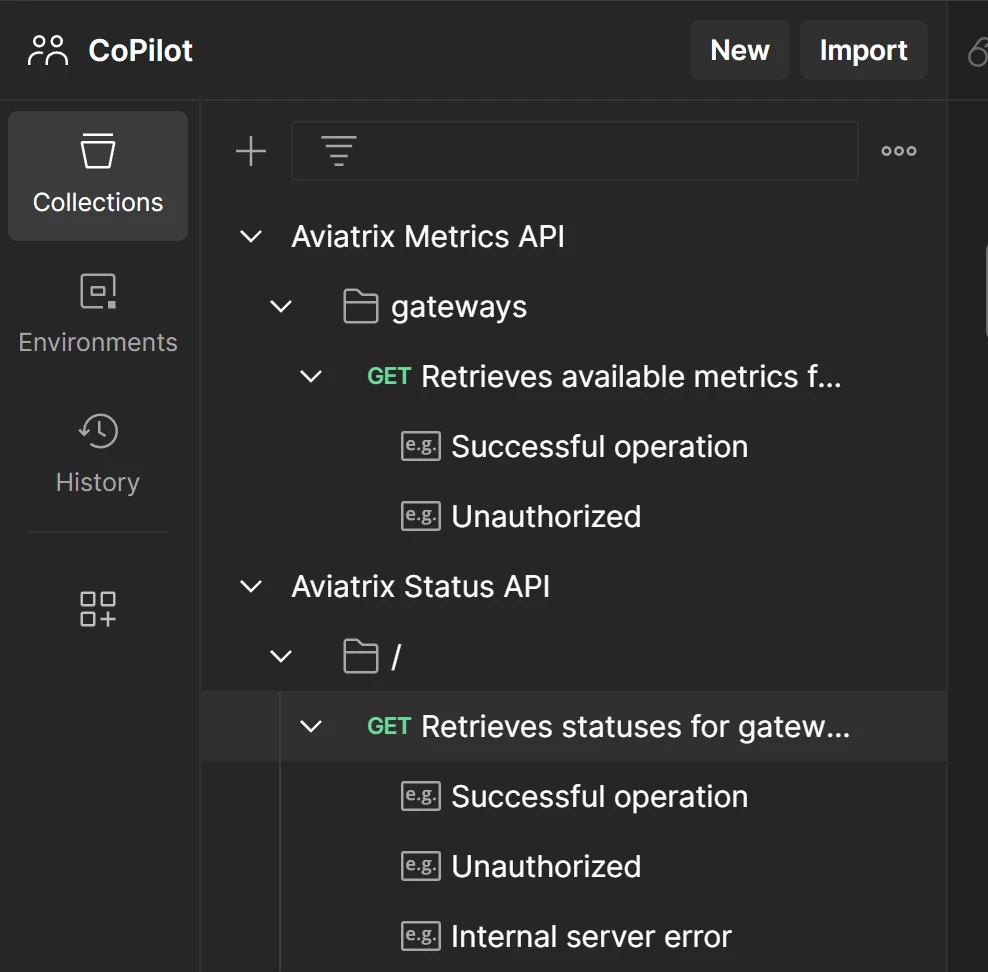
Download the Metrics and Status API Collections
Deploying Prometheus and Grafana containers
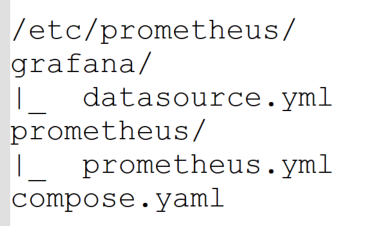
In my Lab, I am running the Prometheus and Grafana as Docker containers. To deploy them you must have the proper configuration files. The following screenshot presents what the structure of files (for both Prometheus and Grafana) looks like.
Content of the compose.yaml file:
services:
  prometheus:
    image: prom/prometheus
    container_name: prometheus
    command:
      - '--config.file=/etc/prometheus/prometheus/prometheus.yml'
    ports:
      - 9090:9090
    restart: unless-stopped
    volumes:
      - ./prometheus:/etc/prometheus/prometheus
      - prom_data:/prometheus/prometheus
  grafana:
    image: grafana/grafana
    container_name: grafana
    ports:
      - 3000:3000
    restart: unless-stopped
    environment:
      - GF_SECURITY_ADMIN_USER=admin
      - GF_SECURITY_ADMIN_PASSWORD=grafana
    volumes:
      - ./grafana:/etc/grafana/provisioning/datasources
volumes:
  prom_data:
Content of the prometheus.yml file:
global:
  scrape_interval: 1m
  scrape_timeout: 10s
  evaluation_interval: 1m
scrape_configs:
- job_name: jakub-copilot
  honor_labels: true
  honor_timestamps: false
  scrape_interval: 30s
  scrape_timeout: 10s
  metrics_path: /metrics-api/v1/gateways
  scheme: https
  authorization:
    type: Bearer
    credentials: <copilot-api-secret-key>
  tls_config:
    insecure_skip_verify: true
  follow_redirects: true
  enable_http2: true
  static_configs:
  - targets:
    - <copilot-public-ip>
- job_name: jakub-copilot-status
  honor_labels: true
  honor_timestamps: false
  scrape_interval: 30s
  scrape_timeout: 10s
  metrics_path: /status-api/v1
  scheme: https
  authorization:
    type: Bearer
    credentials: <copilot-api-secret-key>
  tls_config:
    insecure_skip_verify: true
  follow_redirects: true
  enable_http2: true
  static_configs:
  - targets:
    - <copilot-public-ip>
Content of the datasource.yml file:
apiVersion: 1
datasources:
- name: Prometheus
type: prometheus
url: http://prometheus:9090
isDefault: true
access: proxy
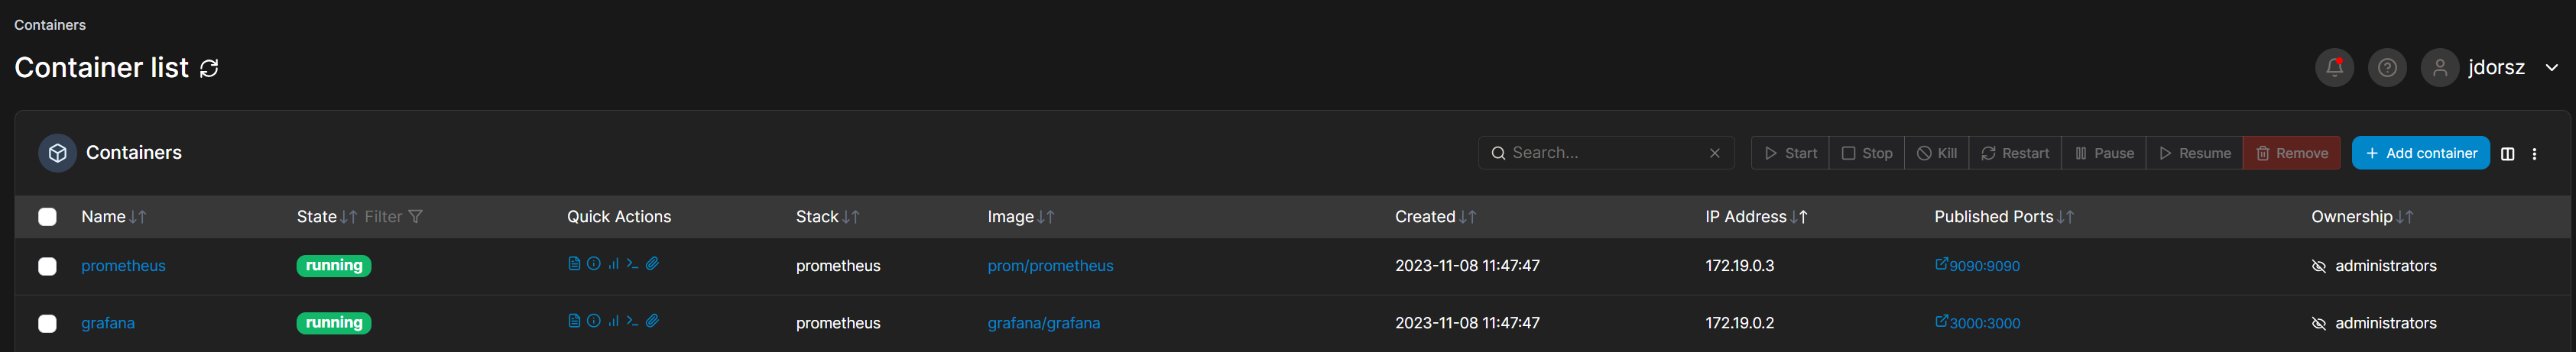
editable: trueMy containers are presented below. As you can see the Prometheus can be accessed via port 9090, while Grafana via 3000.
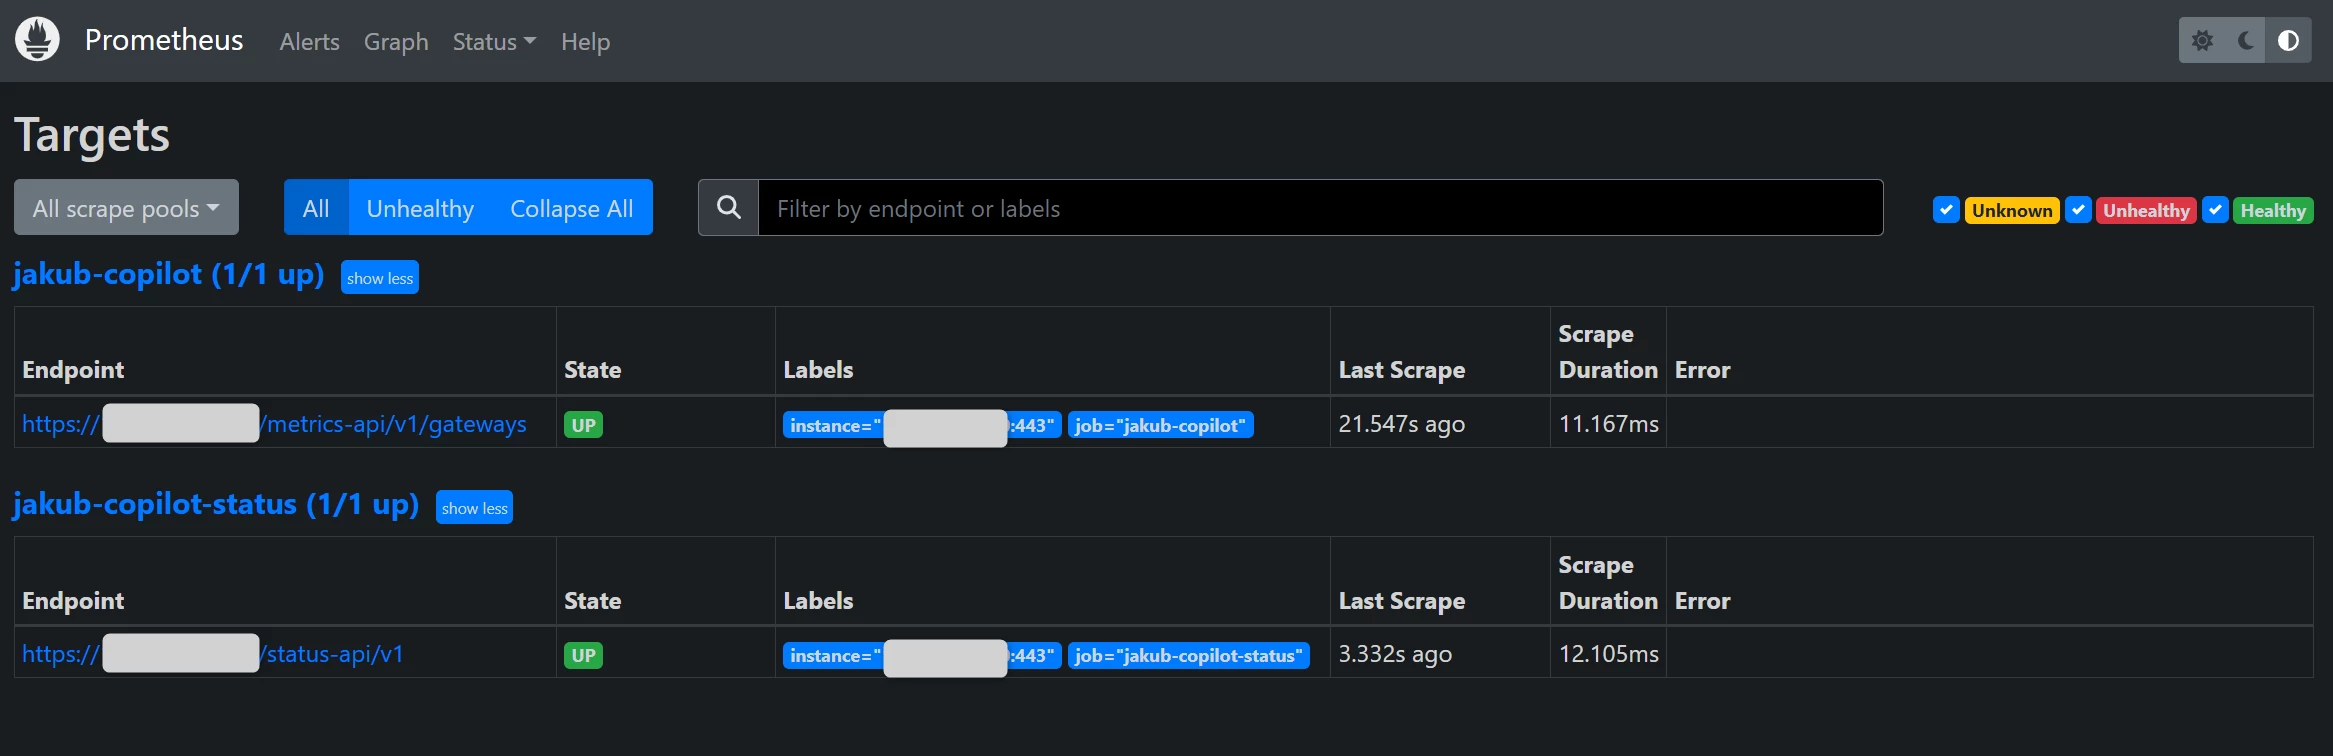
Prometheus Verification
Go to http://<your-server-ip>:9090/targets?search= to verify that Prometheus can connect to the Target(s).
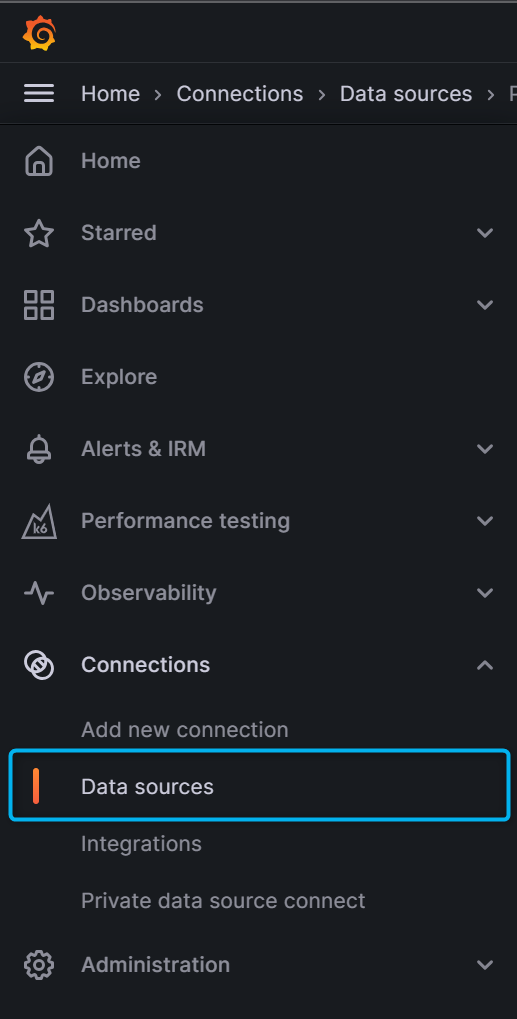
Grafana Configuration
Now you must set up Grafana to connect to Prometheus to request the metrics. Prometheus will be a Data Source for Grafana.
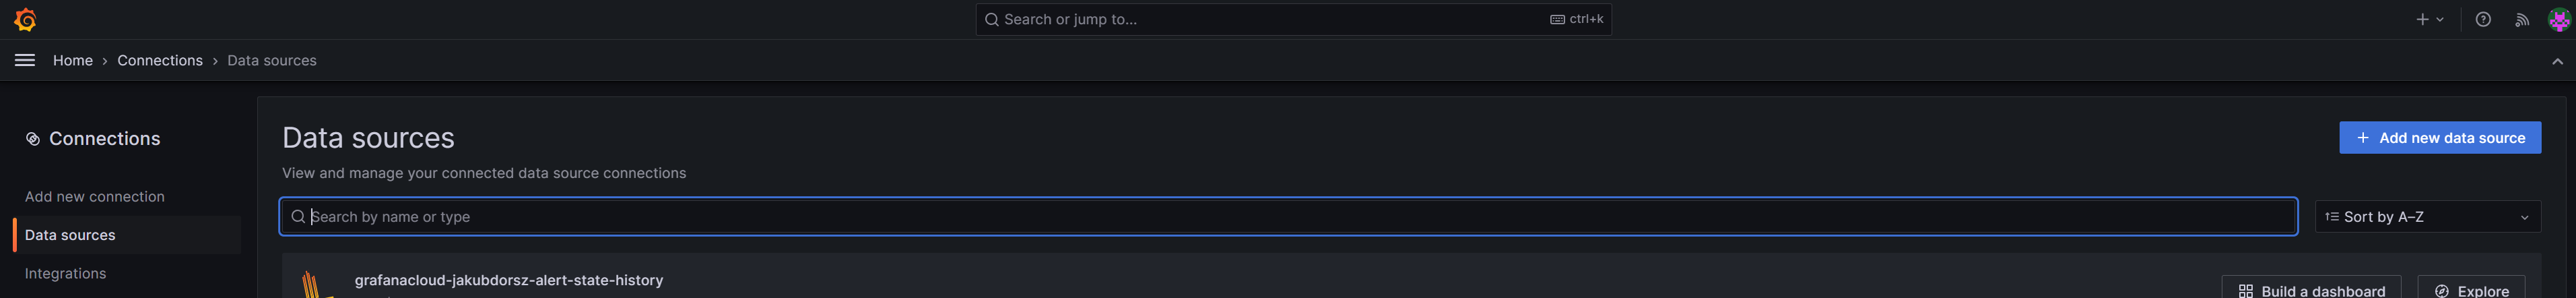
- Go to Home > Connections > Data Sources
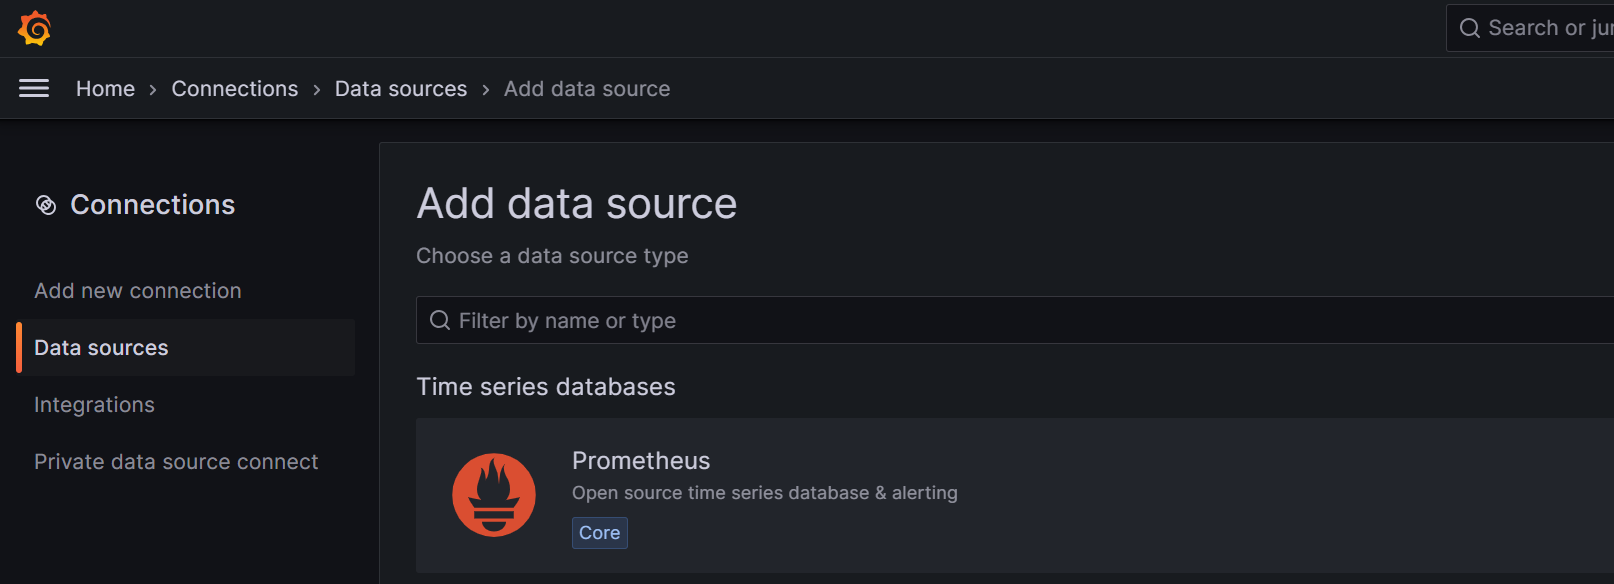
- Choose “+ Add a new data source“.
- Click on “Prometheus“
- Create a new connection. Provide the name and the URL. Your URL will be: http://<your-server-ip>:9090
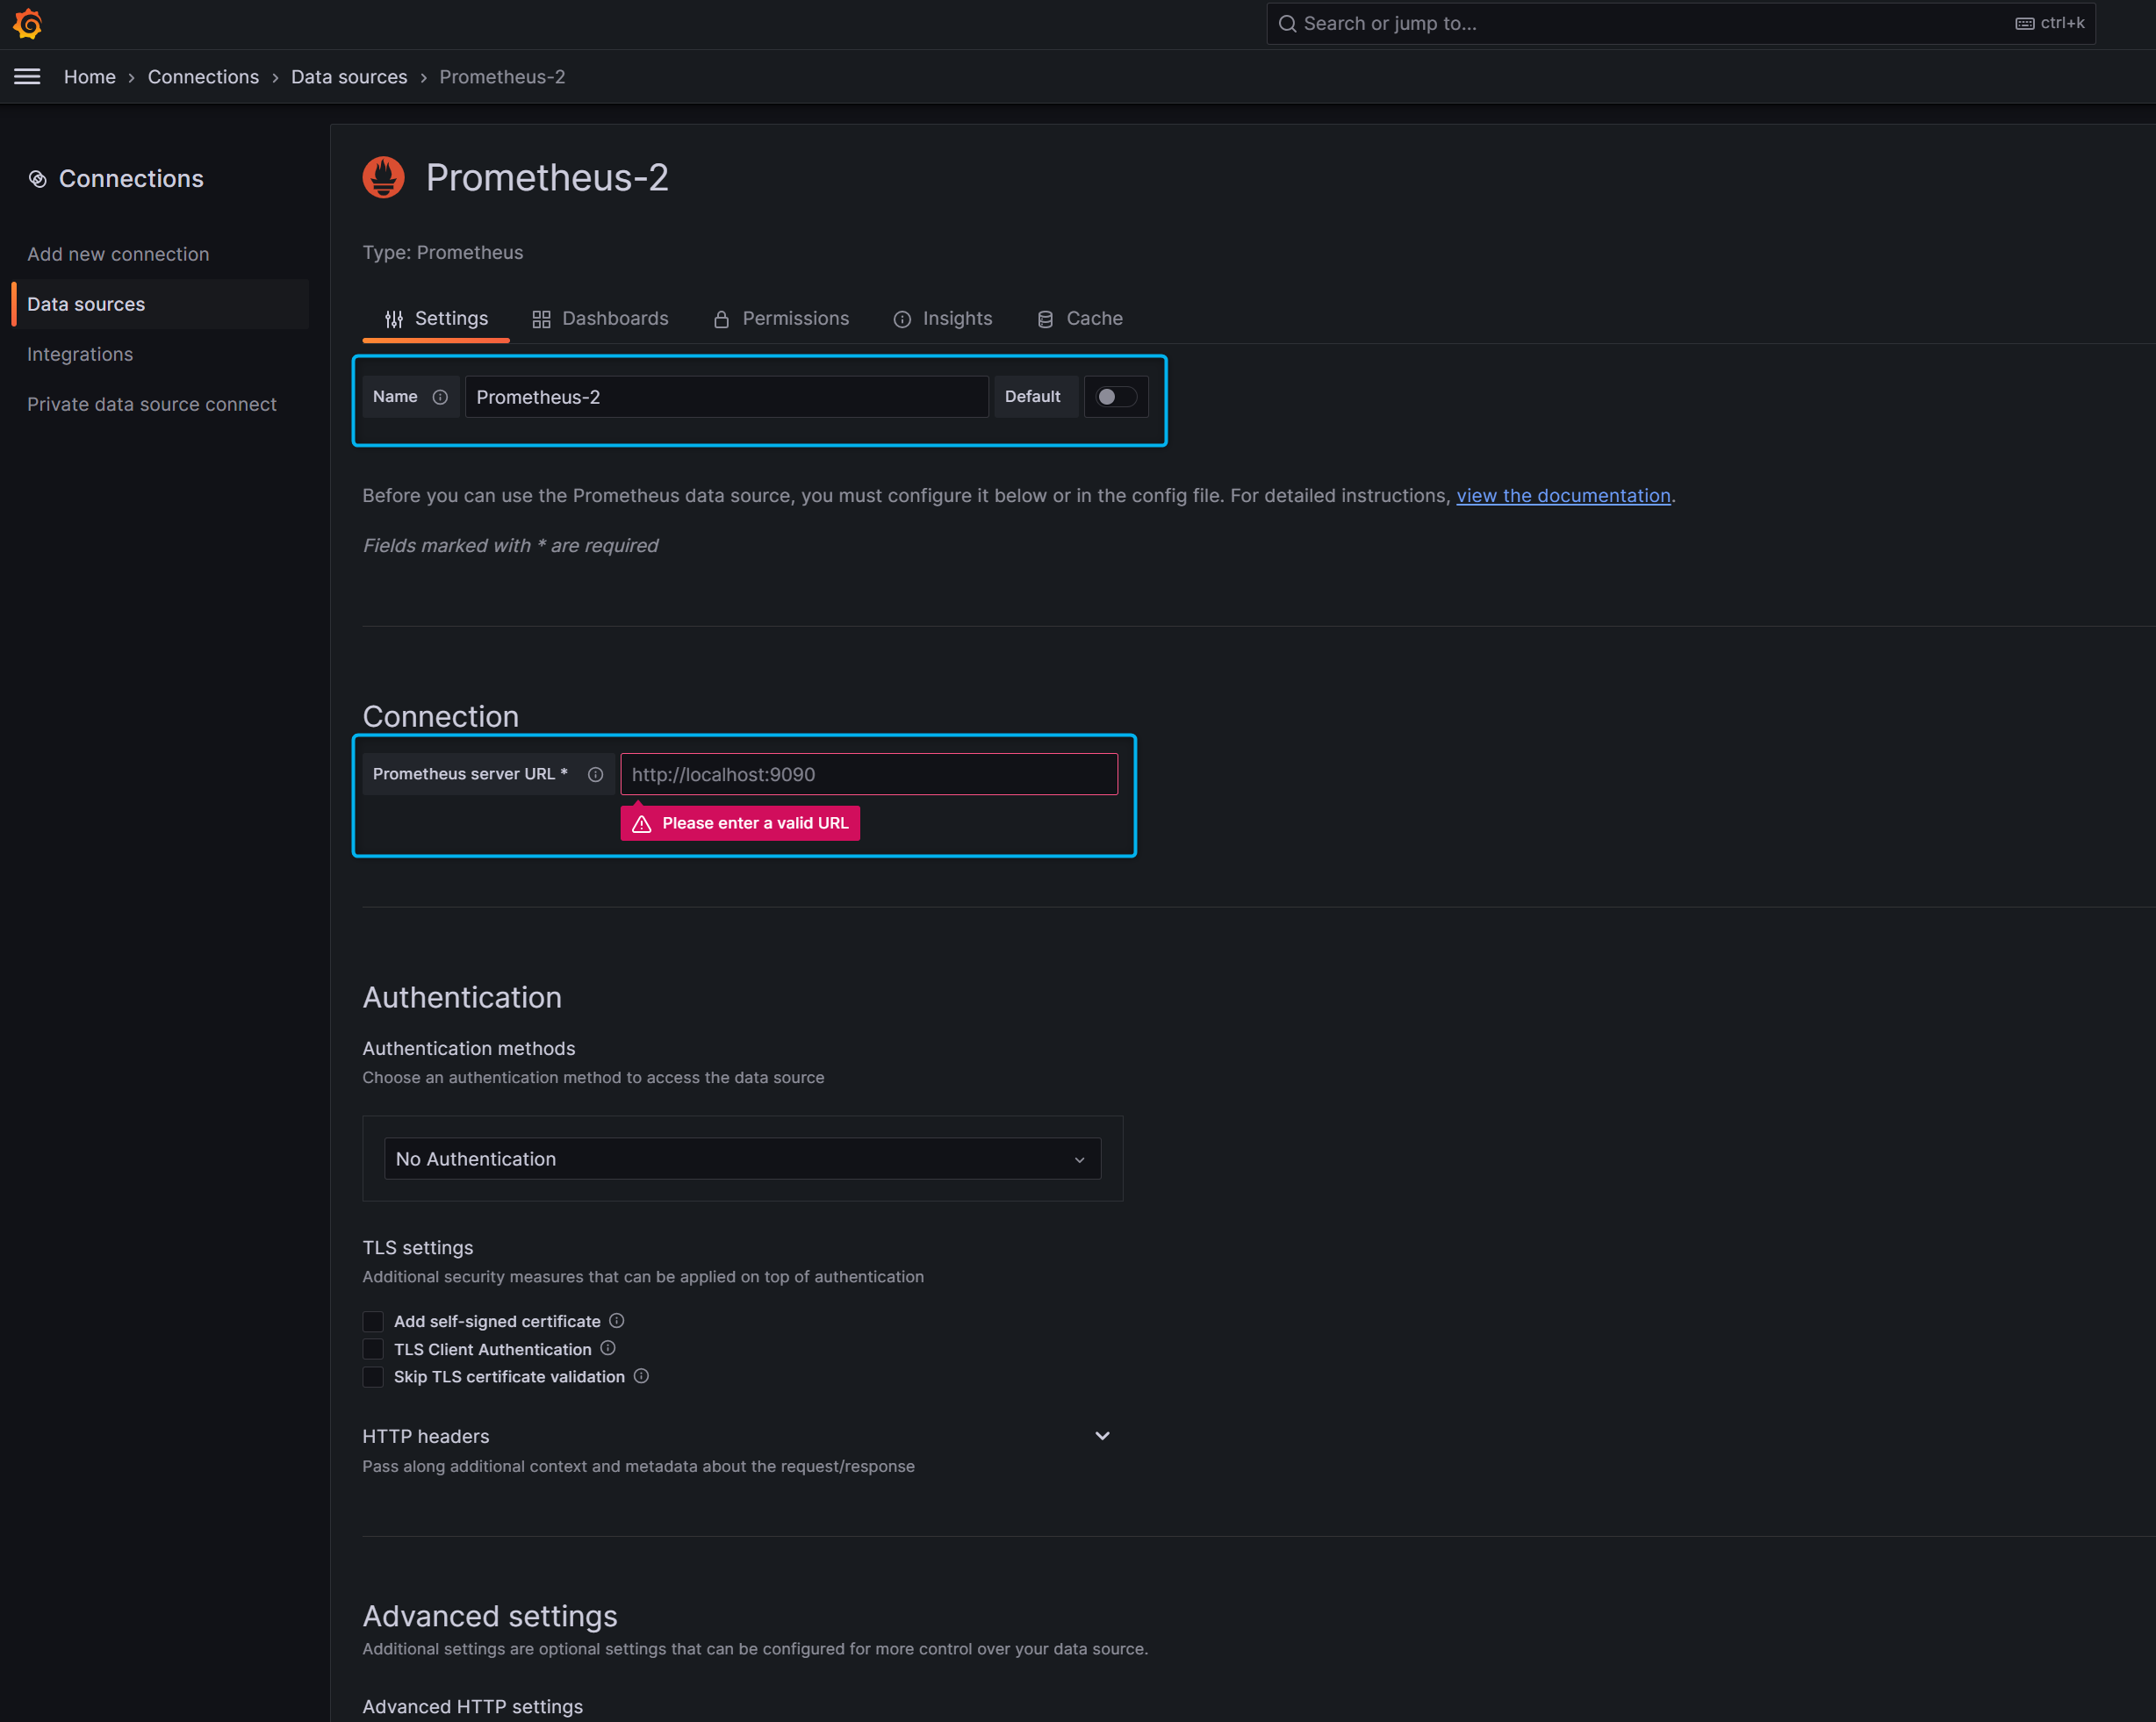
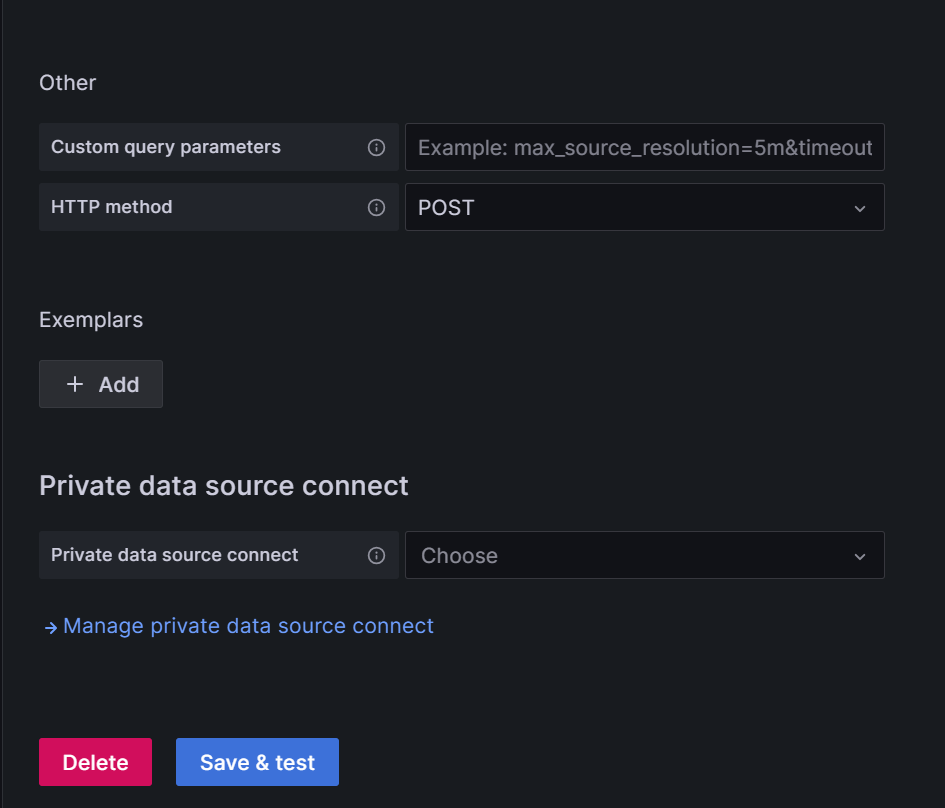
- Click on “Save & test” once done
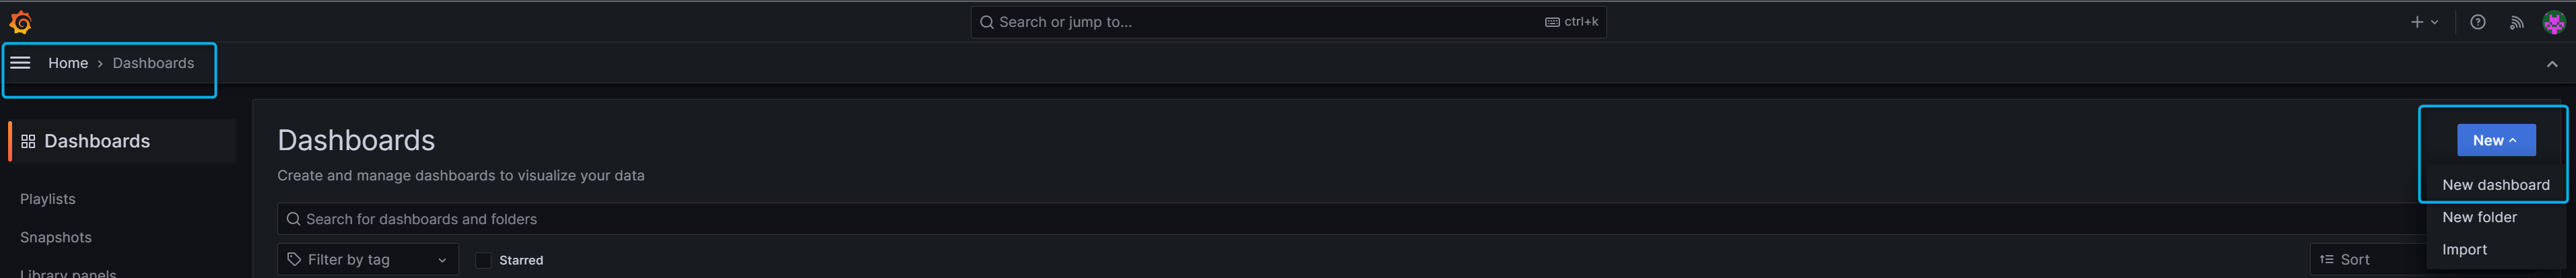
- You are ready to create your dashboard. Go to Home > Dashboards and select “New” and “New Dashboard“
Supported Aviatrix Metrics:
| METRIC NAME |
|---|
| bandwidth_ingress_limit_exceeded |
| bgp_status |
| cpu_idle |
| cpu_ks |
| cpu_us |
| cpu_wait |
| memory_available |
| memory_buf |
| memory_cached |
| memory_free |
| memory_swpd |
| pps_limit_exceeded |
| rate_pkt_drop |
| rate_rd_drop |
| rate_received |
| rate_sent |
| rate_total |
| rate_tx_drop |
| rx_drop |
| scrape_duration_seconds |
| scrape_samples_post_metric_relabeling |
| scrape_samples_scraped |
| scrape_series_added |
| status |
| tx_drop |
| up |
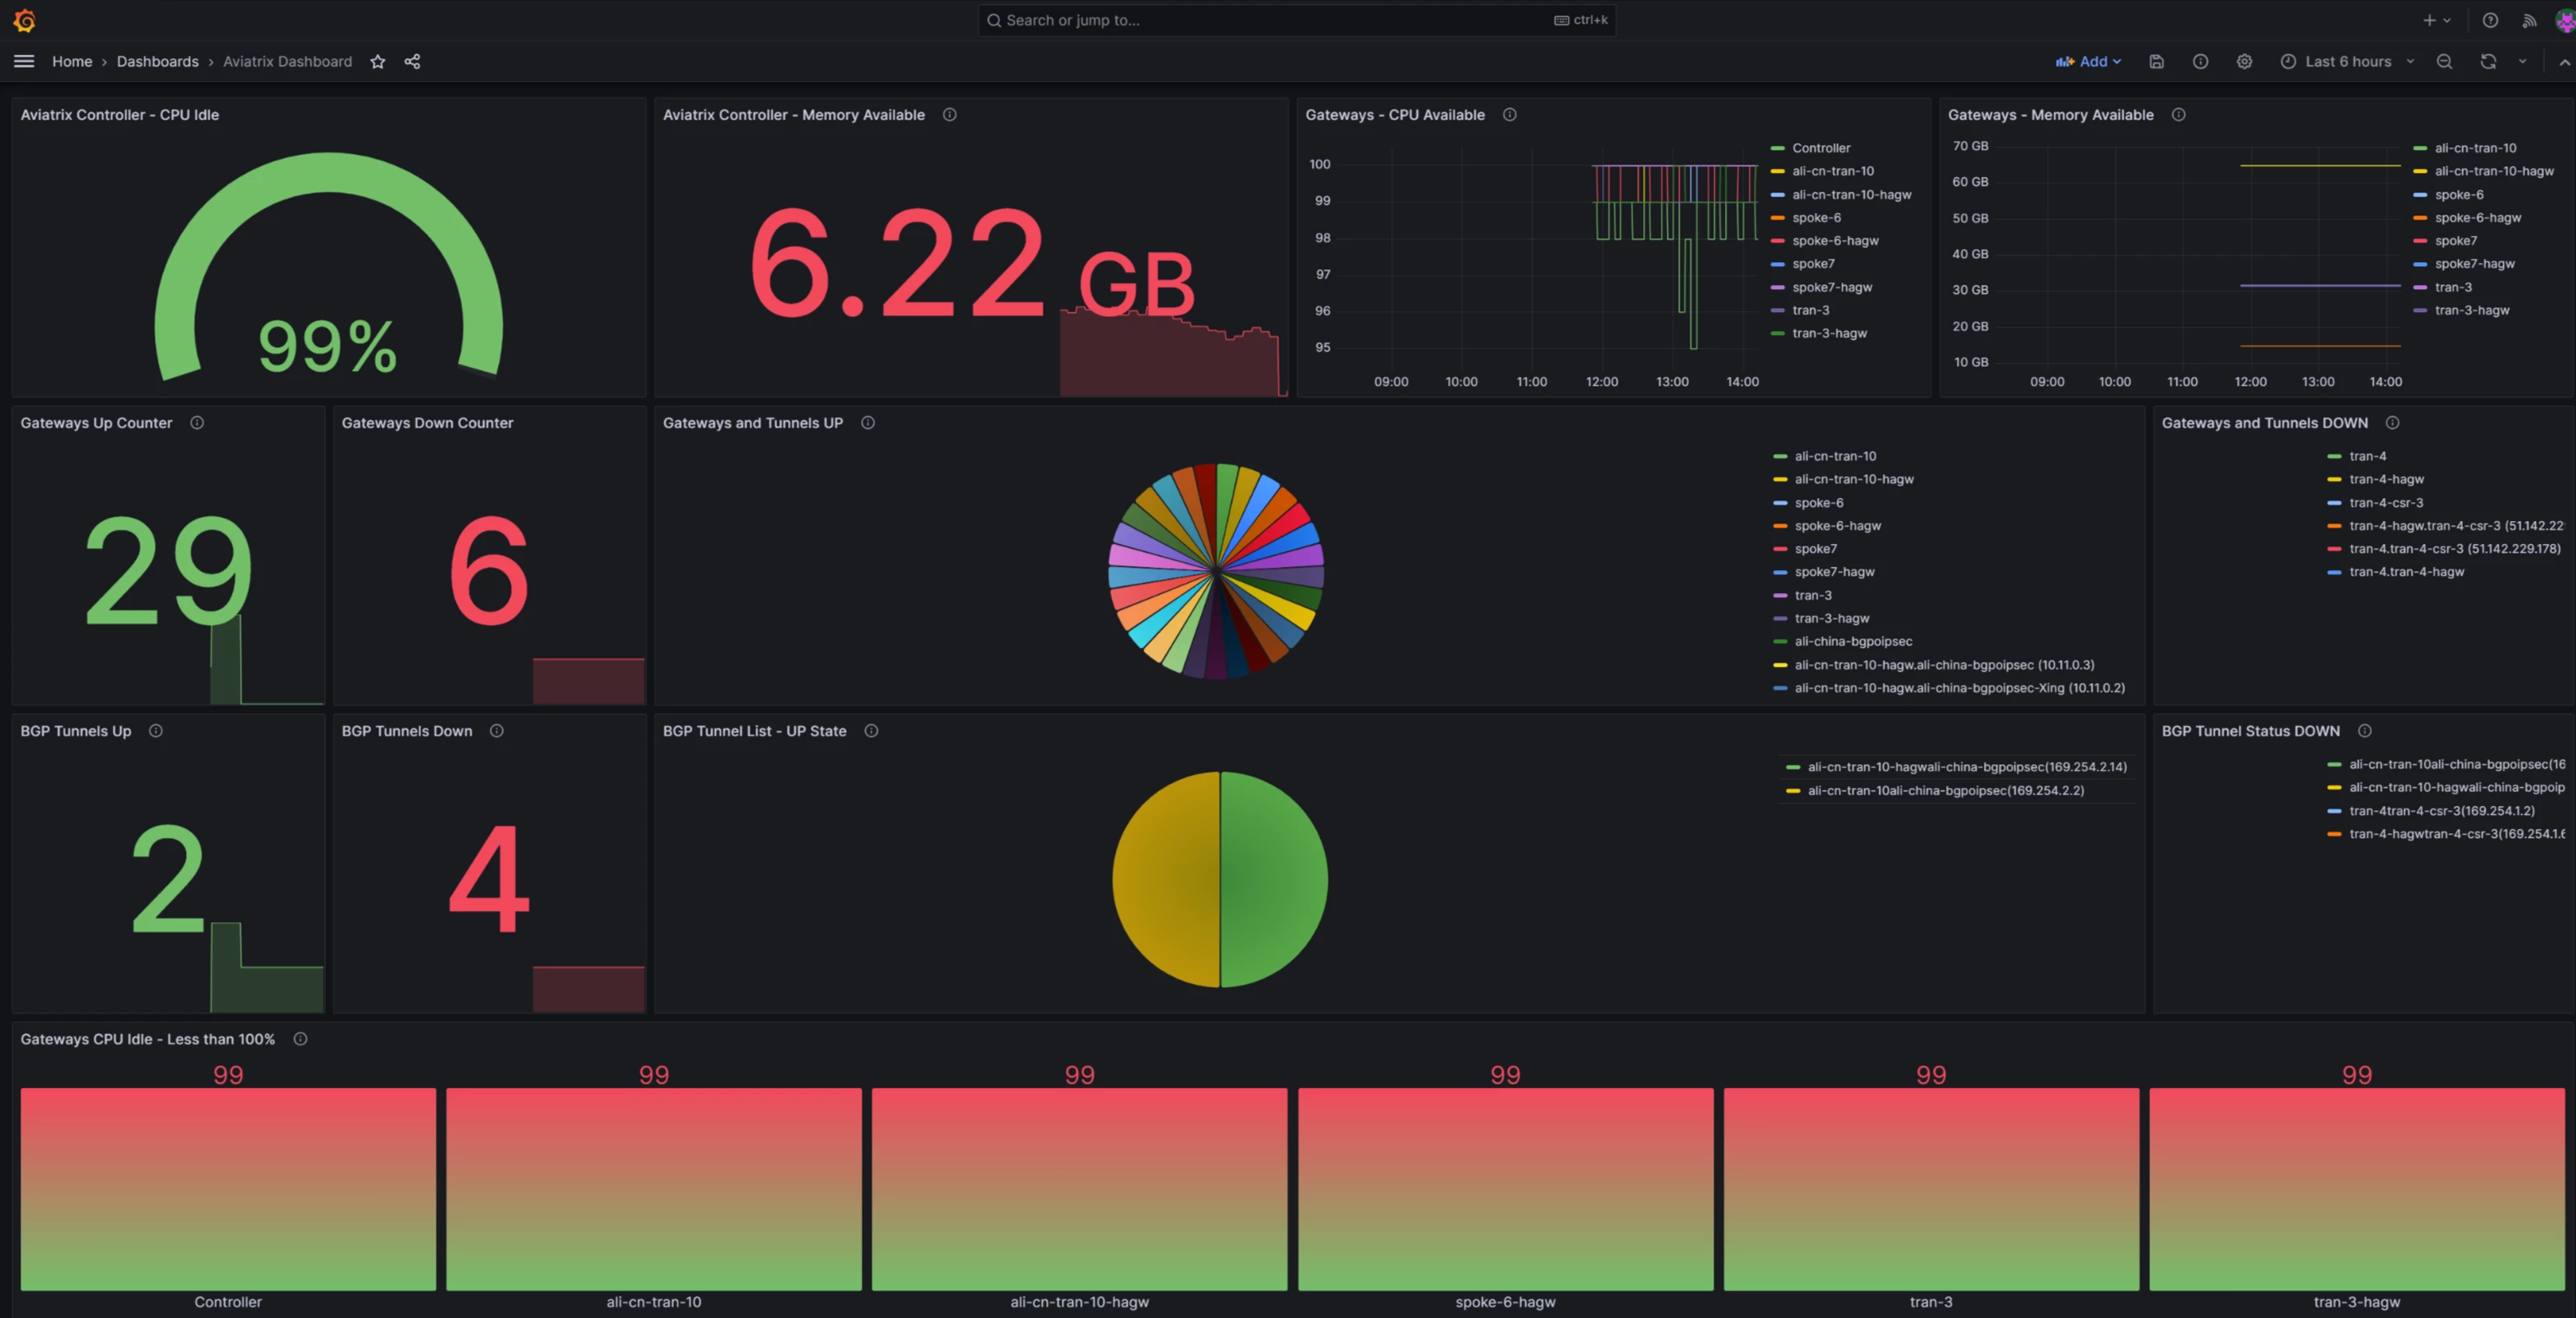
The sample dashboard I created for my Aviatrix environment:
More about Cloud Networking and Aviatrix: https://cloud-cod.com/